NEXT TRIAL WITHOUT DIVING
# summary statistics ____________________________________________________________
subject = "sub"
model_iv1 = "PE_type"
model_iv2 =  "IV_cuelevel"

dv <- "EXPECTUPDATE_NEXT" #"PE"
    subjectwise <- meanSummary(
        df_jepma,
        c(subject, model_iv1, model_iv2), dv
    )
    groupwise <- summarySEwithin(
        data = subjectwise,
        measurevar = "mean_per_sub",
        withinvars = c(model_iv1, model_iv2), idvar = subject
    )
## Automatically converting the following non-factors to factors: PE_type, IV_cuelevel
# calculate mean and se ----------------------------------------------------------------------------
sub_mean <- "mean_per_sub"
group_mean <- "mean_per_sub_norm_mean"
se <- "se"
subject <- "sub"
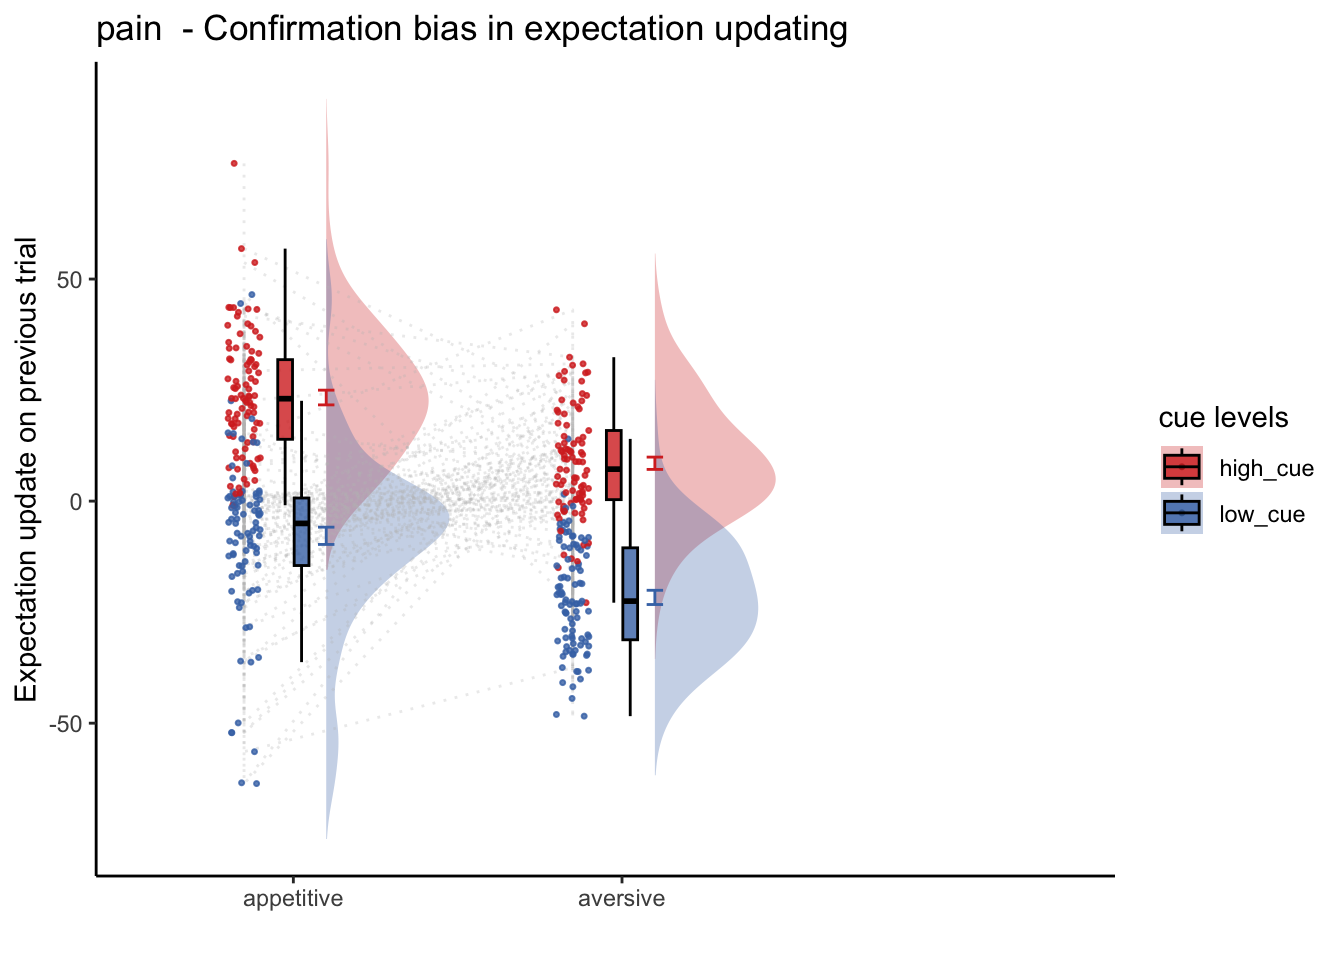
ggtitle <- paste(taskname, " - Confirmation bias in expectation updating")
legend_title <- "cue levels"
title <- paste(taskname, " - Actual")
xlab <- ""
ylab <- "Expectation update on previous trial"
ylim <- c(-250,250)
dv_keyword <- "learning rate"
if (any(startsWith(dv_keyword, c("expect", "Expect")))) {
color <- c("#1B9E77", "#D95F02")
} else {
color <- c( "#D73027", "#4575B4")
} # if keyword starts with]
analysis_dir = '/Users/h/Desktop'
plot_savefname <- file.path(
analysis_dir,
paste("raincloud_task-", taskname,
"_rating-", dv_keyword,
"_", as.character(Sys.Date()), "_cooksd.png",
sep = ""
)
)
plot_halfrainclouds_twofactor(subjectwise, groupwise,
model_iv1, model_iv2, sub_mean, group_mean, se, subject,
ggtitle, legend_title, xlab, ylab, task_name, ylim,
w, h, dv_keyword, color, save_fname)
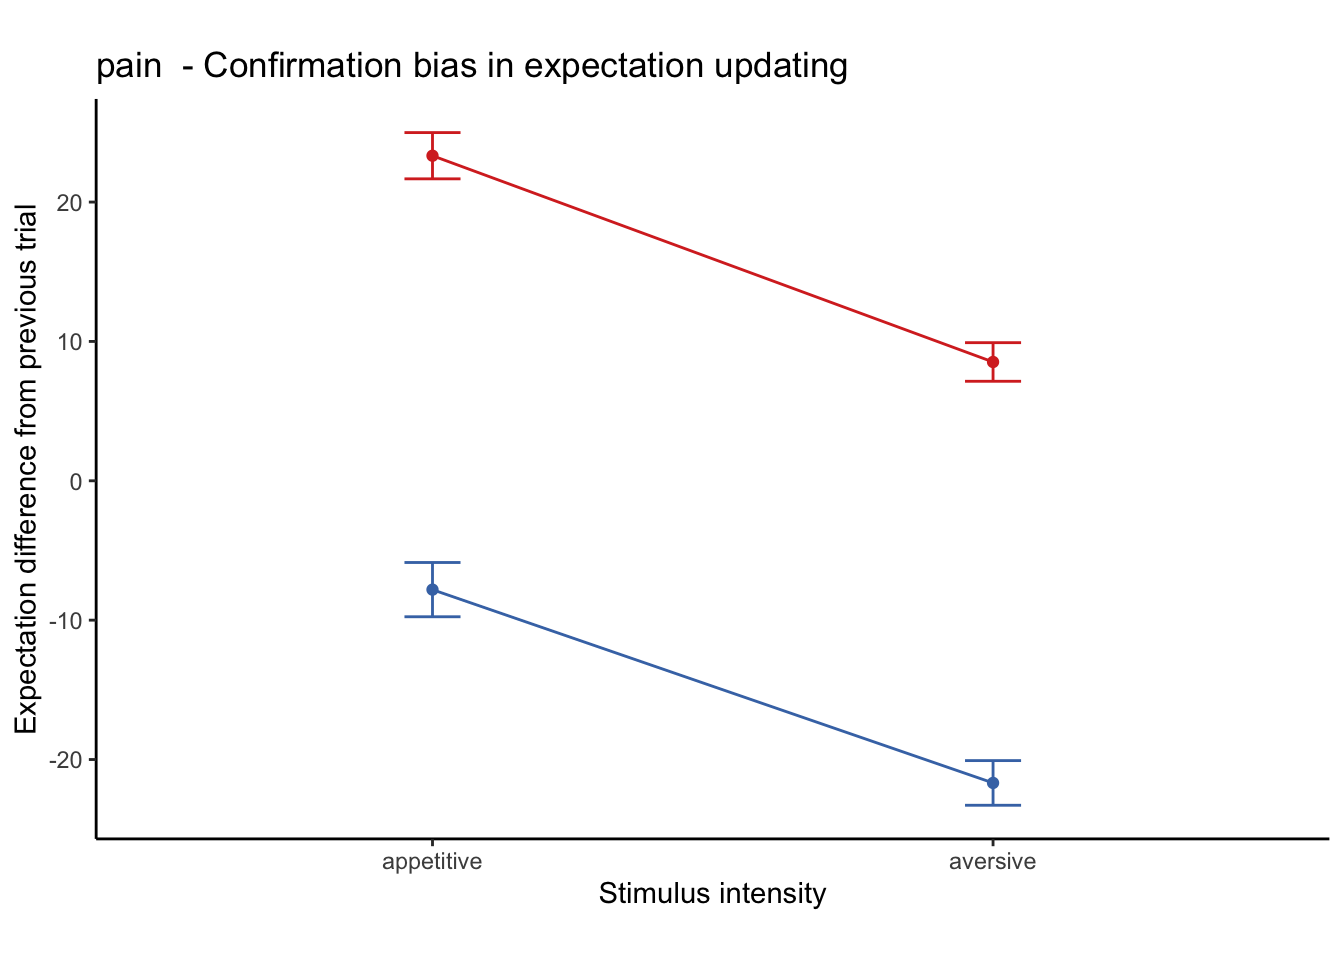
plot_lineplot_twofactor(groupwise, model_iv1, model_iv2, "mean_per_sub_norm_mean", error = "se",
                      color = c( high_cue = "#D73027", low_cue = "#4575B4"),
                      ggtitle,
                      xlab= "Stimulus intensity",
                      ylab = "Expectation difference from previous trial")
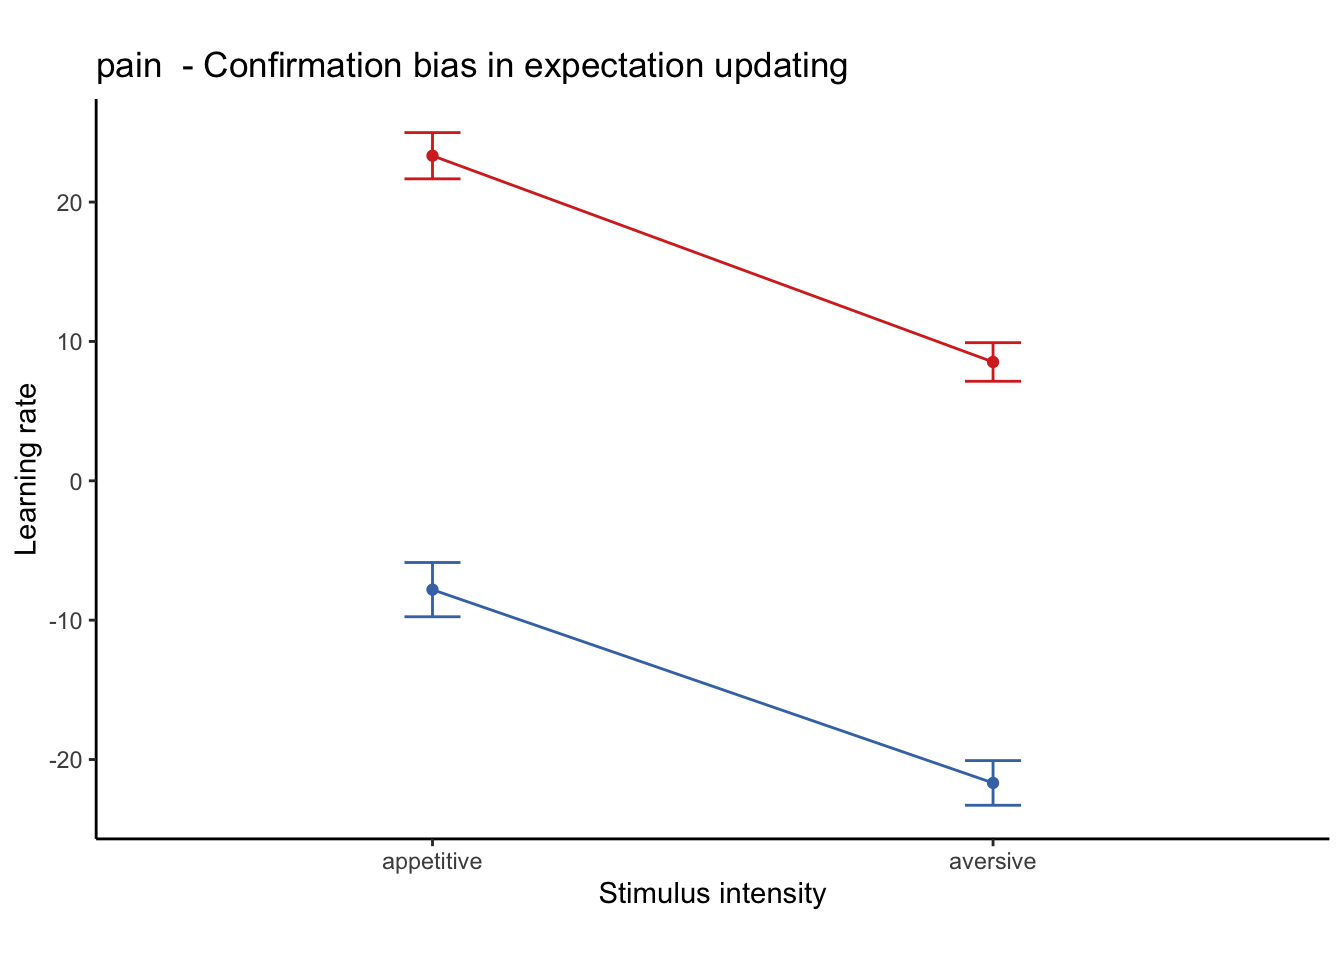
plot_lineplot_twofactor(groupwise, model_iv1, model_iv2, "mean_per_sub_norm_mean", error = "se",
                      color = c( high_cue = "#D73027", low_cue = "#4575B4"),
                      ggtitle,
                      xlab= "Stimulus intensity",
                      ylab = "Learning rate")
library(plyr)
subjectwise_cuetype = meanSummary_2dv(DATA=df_jepma,
        GROUP = c("sub", "trialindex", "IV_cuelevel"), DV1 = "PE", DV2 = "EXPECTUPDATE")
plot_twovariable(subjectwise_cuetype, iv1 = "DV1_mean_per_sub", iv2 = "DV2_mean_per_sub", group = "IV_cuelevel", subject = "sub", xmin=-50, xmax=50, ymin=-50,ymax=50,
xlab="PE", ylab="Expectation update", ggtitle="", color_scheme=c( high_cue = "#D73027", low_cue = "#4575B4"), alpha=.8, fit_lm=TRUE, lm_method = "lm", identity_line=TRUE, size=NULL)
# subjectwise_cuetype_groupby = meanSummary_2dv(DATA=df_jepma,
#         GROUP = c("sub", "IV_cuelevel"), DV1 = "PE", DV2 = "EXPECTUPDATE_JEPMA")
# plot_twovariable(df_jepma, iv1 = "PE", iv2 = "EXPECTUPDATE", group = "IV_cuelevel", subject = "sub", xmin=-50, xmax=50, ymin=-50,ymax=50,
# xlab="PE", ylab="Expectation update", ggtitle="", color_scheme=c( high_cue = "#D73027", low_cue = "#4575B4"), alpha=.8, fit_lm=TRUE, lm_method = "lm", identity_line=TRUE, size=NULL)