Chapter 28 [fMRI] Kragel2018 ~ singletrial
author: "Heejung Jung"
date: "2023-03-23"
What is the purpose of this notebook?
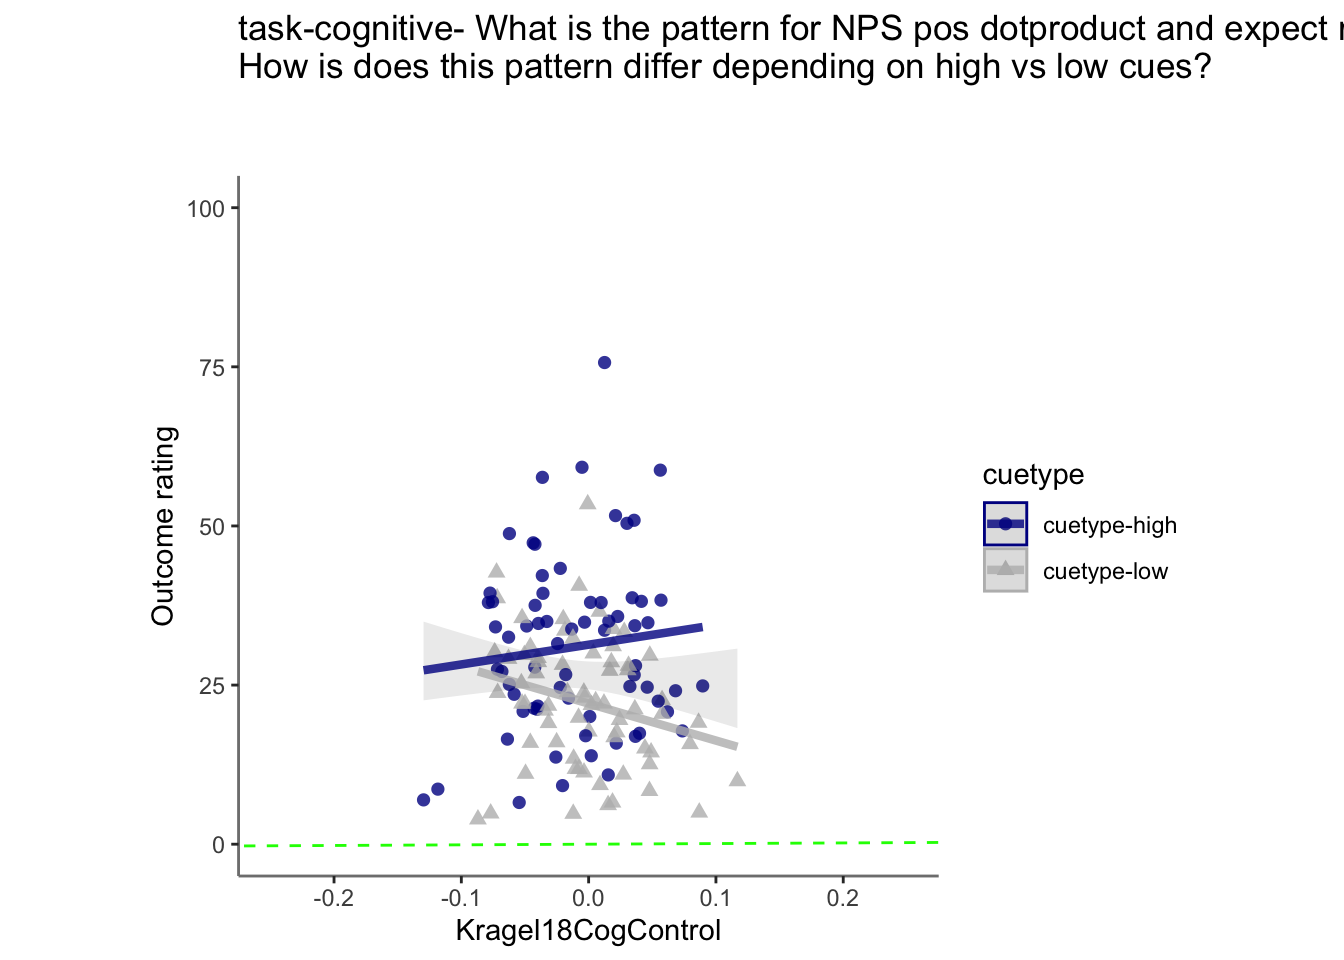
- Here, I model NPS dot products as a function of cue, stimulus intensity and expectation ratings.
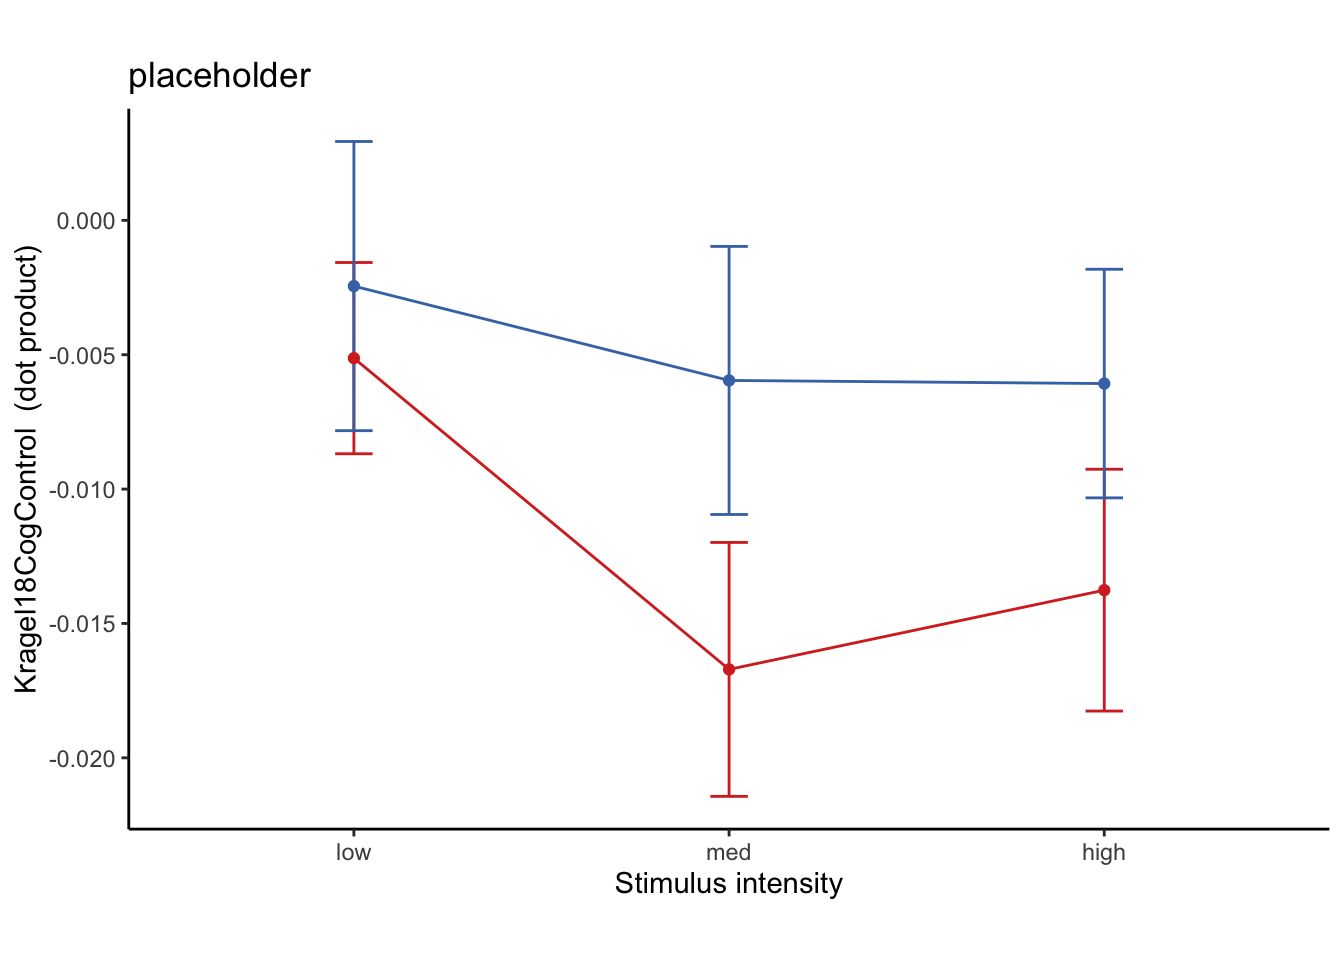
- One of the findings is that low cues lead to higher Cognitive Control dotproducts in the medium intensity group, and that this effect becomes non-significant across sessions.
- 03/23/2023: For now, I’m grabbing participants that have complete data, i.e. 18 runs, all three sessions. N = 65
## [1] "/Users/h/Dropbox (Dartmouth College)/projects_dropbox/social_influence_analysis/analysis/fmri/nilearn/signature_extract/signature-Kragel18CogControl_sub-all_runtype-pvc_event-stimulus.tsv"pvc.sub$trial_ind <- pvc.sub$trial_index -1
pvc.sub$sub <- sprintf("sub-%04d", pvc.sub$src_subject_id)
pvc.sub$ses <- sprintf("ses-%02d", pvc.sub$session_id)
pvc.sub$run <- sprintf("run-%02d", pvc.sub$param_run_num)
pvc.sub$runtype <- sprintf("runtype-%s", pvc.sub$param_task_name)
pvc.sub$trial <- sprintf("trial-%03d", pvc.sub$trial_ind)
pvc.sub[c('cue', 'DEPc')] <- str_split_fixed(pvc.sub$param_cue_type , '_', 2)
pvc.sub$cuetype <- sprintf("cuetype-%s", pvc.sub$cue)
pvc.sub[c('stimintensity', 'DEP')] <- str_split_fixed(pvc.sub$param_stimulus_type , '_', 2)
# merge
pvc.beh <- pvc.sub[,c("sub", "ses", "run", "runtype", "trial", "cuetype", "stimintensity","event02_expect_angle", "event04_actual_angle")]
df_merge <- merge(pvc, pvc.beh,
by.x = c("sub", "ses", "run", "runtype", "trial", "cuetype", "stimintensity"),
by.y = c("sub", "ses", "run", "runtype", "trial", "cuetype", "stimintensity")
)28.1 Kragel2018 ~ 3 task * 3 stimulus_intensity
Q. What does the Cognitive control pattern look like for the three tasks?
| pain | vicarious | cognitive | |
|---|---|---|---|
| task_V_gt_P | -0.50 | 0.50 | 0.00 |
| task_C_gt_PV | -0.34 | -0.34 | 0.66 |
model.alltask <- lmer(Kragel18CogControl ~ task_V_gt_P*stim_factor + task_C_gt_PV*stim_factor + (task|sub), data = pvc)
sjPlot::tab_model(model.alltask)| Kragel18CogControl | |||
|---|---|---|---|
| Predictors | Estimates | CI | p |
| (Intercept) | -0.03 | -0.04 – -0.03 | <0.001 |
| task V gt P | 0.03 | 0.02 – 0.04 | <0.001 |
| stim factor [low] | 0.00 | -0.00 – 0.00 | 0.720 |
| stim factor [med] | 0.00 | -0.00 – 0.00 | 0.810 |
| task C gt PV | 0.02 | 0.01 – 0.03 | <0.001 |
|
task V gt P * stim factor [low] |
0.01 | 0.01 – 0.02 | 0.001 |
|
task V gt P * stim factor [med] |
0.00 | -0.00 – 0.01 | 0.431 |
|
stim factor [low] * task C gt PV |
0.01 | 0.01 – 0.02 | <0.001 |
|
stim factor [med] * task C gt PV |
0.01 | -0.00 – 0.01 | 0.101 |
| Random Effects | |||
| σ2 | 0.01 | ||
| τ00 sub | 0.00 | ||
| τ11 sub.taskpain | 0.00 | ||
| τ11 sub.taskvicarious | 0.00 | ||
| ρ01 | -0.69 | ||
| -0.66 | |||
| ICC | 0.19 | ||
| N sub | 111 | ||
| Observations | 19428 | ||
| Marginal R2 / Conditional R2 | 0.043 / 0.223 | ||
eta-squared
| Parameter | Eta2_partial | CI | CI_low | CI_high |
|---|---|---|---|---|
| task_V_gt_P | 0.3009101 | 0.95 | 0.1853008 | 1 |
| stim_factor | 0.0000070 | 0.95 | 0.0000000 | 1 |
| task_C_gt_PV | 0.3141347 | 0.95 | 0.1981308 | 1 |
| task_V_gt_P:stim_factor | 0.0006843 | 0.95 | 0.0001644 | 1 |
| stim_factor:task_C_gt_PV | 0.0010896 | 0.95 | 0.0004037 | 1 |
Cohen’s d
| t | df | d | |
|---|---|---|---|
| task_V_gt_P | 5.3894497 | 136.0766 | 0.9240228 |
| stim_factorlow | 0.3579918 | 19085.1501 | 0.0051827 |
| stim_factormed | 0.2398900 | 19085.1501 | 0.0034729 |
| task_C_gt_PV | 4.8174290 | 153.0070 | 0.7789143 |
| task_V_gt_P:stim_factorlow | 3.4494916 | 19085.1501 | 0.0499387 |
| task_V_gt_P:stim_factormed | 0.7878756 | 19085.1501 | 0.0114062 |
| stim_factorlow:task_C_gt_PV | 4.5069919 | 19085.1501 | 0.0652483 |
| stim_factormed:task_C_gt_PV | 1.6383590 | 19085.1501 | 0.0237187 |
28.2 Kragel2018 ~ 2 cue x 3 stimulus_intensity
Q. Within cognitive task, does stimulus intenisty level and cue level significantly predict Kragel2018 dotproducts?
28.2.1 Linear model ver 1: Kragel2018 ~ stimulus_intenisy * cue
model.cogstim <- lmer(Kragel18CogControl ~ stim_con_linear + stim_con_quad +(stim_con_linear + stim_con_quad |sub), data = data_screen)## boundary (singular) fit: see help('isSingular')sjPlot::tab_model(model.cogstim)| Kragel18CogControl | |||
|---|---|---|---|
| Predictors | Estimates | CI | p |
| (Intercept) | -0.01 | -0.02 – 0.00 | 0.214 |
| stim con linear | -0.01 | -0.02 – -0.00 | 0.002 |
| stim con quad | -0.00 | -0.01 – 0.00 | 0.266 |
| Random Effects | |||
| σ2 | 0.01 | ||
| τ00 sub | 0.00 | ||
| τ11 sub.stim_con_linear | 0.00 | ||
| τ11 sub.stim_con_quad | 0.00 | ||
| ρ01 | 0.87 | ||
| 0.93 | |||
| N sub | 71 | ||
| Observations | 2743 | ||
| Marginal R2 / Conditional R2 | 0.004 / NA | ||
28.2.2 Linear model ver 2: Kragel2018 ~ stimulus_intenisy * cue
## boundary (singular) fit: see help('isSingular')| Kragel18CogControl | |||
|---|---|---|---|
| Predictors | Estimates | CI | p |
| (Intercept) | -0.01 | -0.02 – 0.00 | 0.192 |
| CUE high gt low | -0.00 | -0.01 – 0.00 | 0.136 |
| stim con linear | -0.01 | -0.02 – -0.00 | 0.002 |
| stim con quad | -0.00 | -0.01 – 0.00 | 0.317 |
|
CUE high gt low * stim con linear |
0.00 | -0.01 – 0.02 | 0.744 |
|
CUE high gt low * stim con quad |
-0.01 | -0.02 – 0.01 | 0.320 |
| Random Effects | |||
| σ2 | 0.01 | ||
| τ00 sub | 0.00 | ||
| τ11 sub.CUE_high_gt_low | 0.00 | ||
| ρ01 sub | 1.00 | ||
| N sub | 71 | ||
| Observations | 2743 | ||
| Marginal R2 / Conditional R2 | 0.005 / NA | ||
Linear model ver 2: eta-squared
| Parameter | Eta2_partial | CI | CI_low | CI_high |
|---|---|---|---|---|
| CUE_high_gt_low | 0.0074001 | 0.95 | 0.0000000 | 1 |
| stim_con_linear | 0.0035597 | 0.95 | 0.0007787 | 1 |
| stim_con_quad | 0.0003745 | 0.95 | 0.0000000 | 1 |
| CUE_high_gt_low:stim_con_linear | 0.0000399 | 0.95 | 0.0000000 | 1 |
| CUE_high_gt_low:stim_con_quad | 0.0003703 | 0.95 | 0.0000000 | 1 |
Linear model ver 2: Cohen’s d: CognitiveControl stimulus_intensity d = 0.73, cue d = 0.069
| t | df | d | |
|---|---|---|---|
| CUE_high_gt_low | -1.4919521 | 298.5707 | -0.1726877 |
| stim_con_linear | -3.0896597 | 2672.1084 | -0.1195401 |
| stim_con_quad | -1.0005545 | 2672.3127 | -0.0387104 |
| CUE_high_gt_low:stim_con_linear | 0.3265372 | 2674.7348 | 0.0126276 |
| CUE_high_gt_low:stim_con_quad | -0.9950382 | 2672.7716 | -0.0384936 |
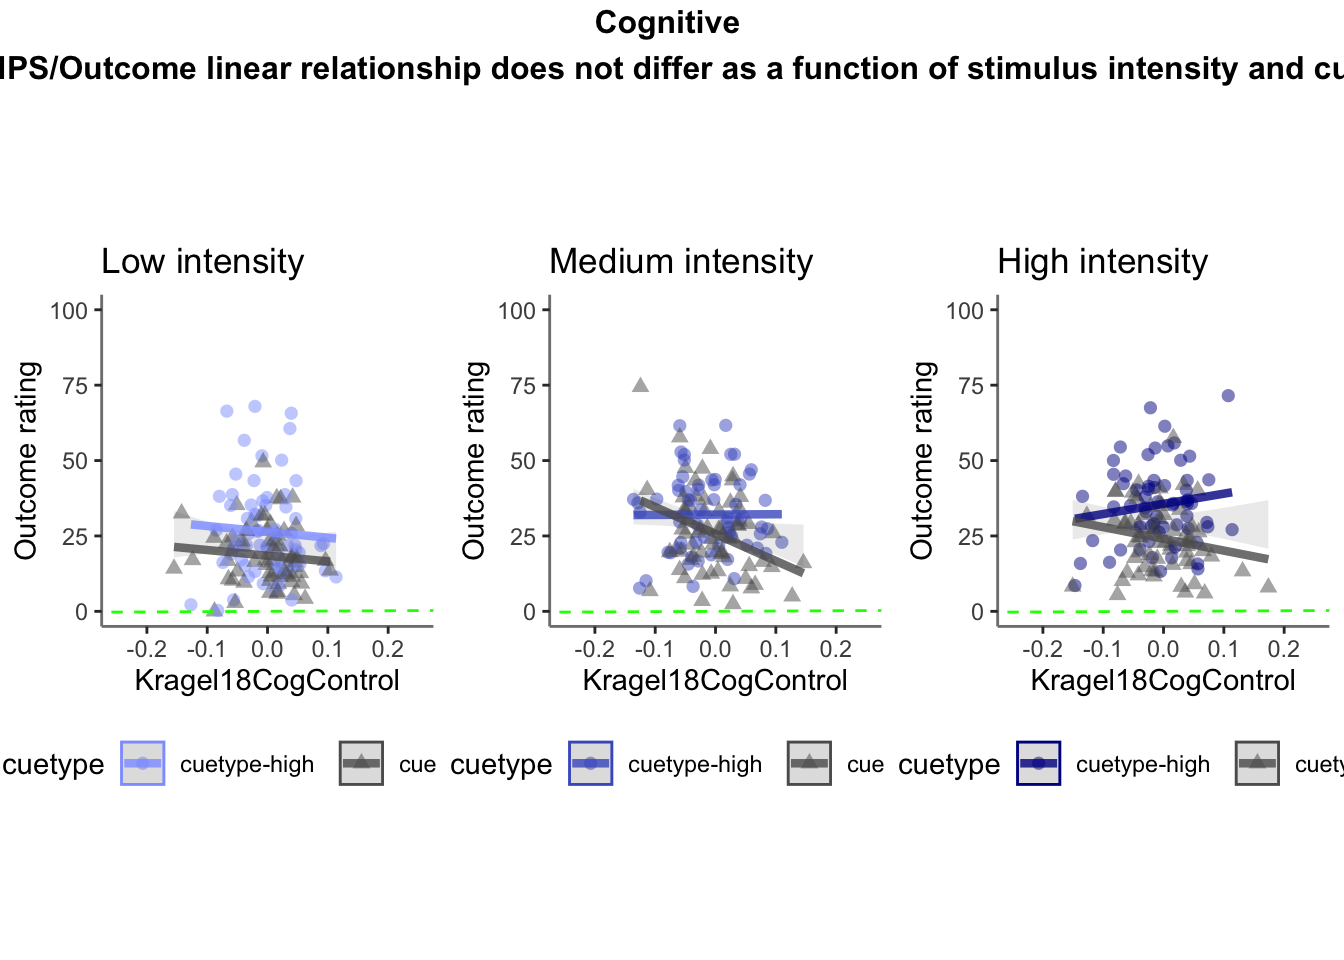
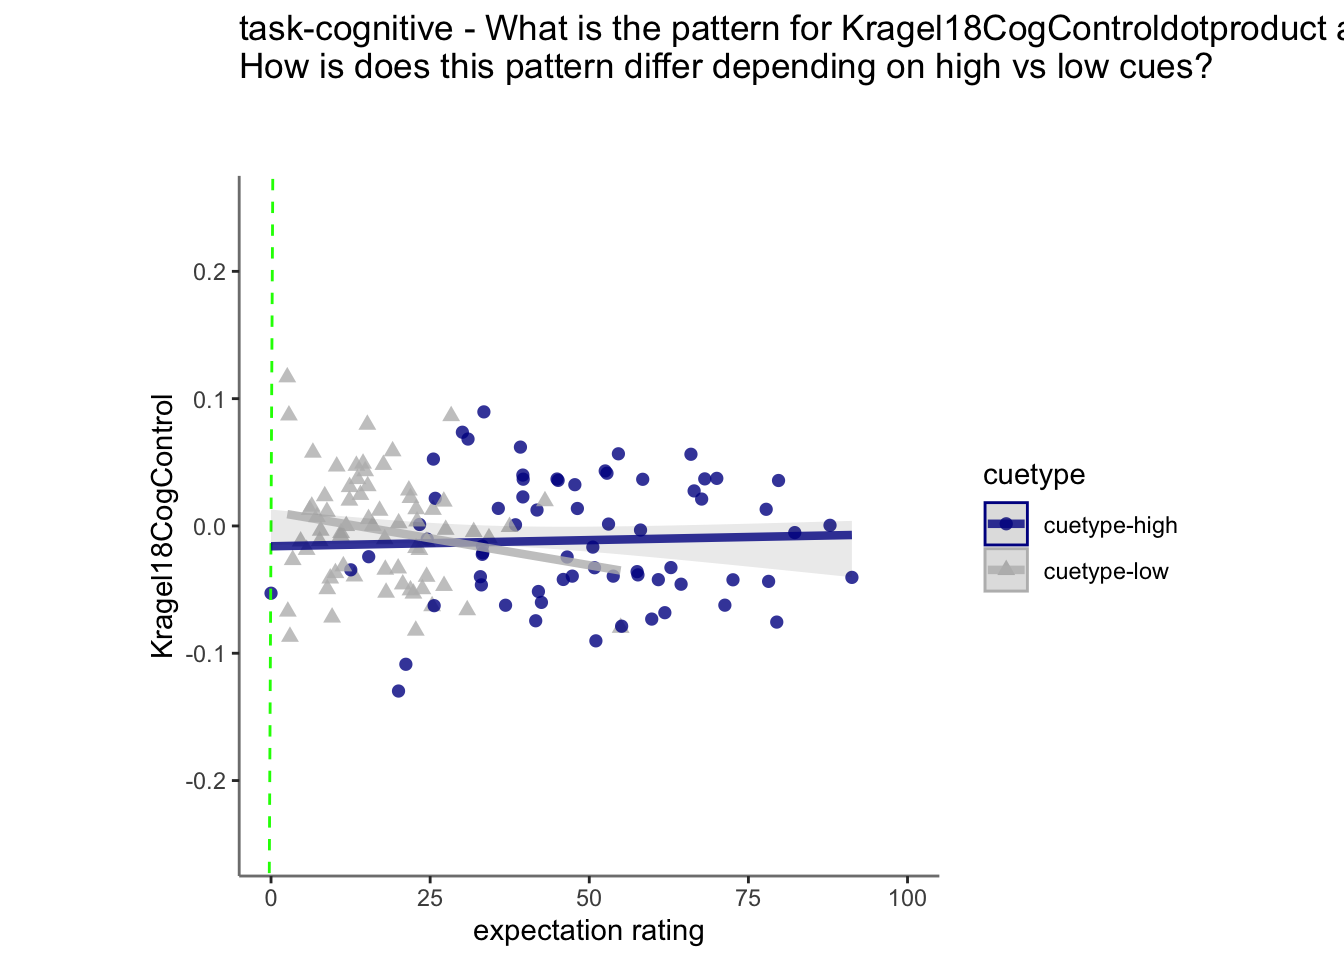
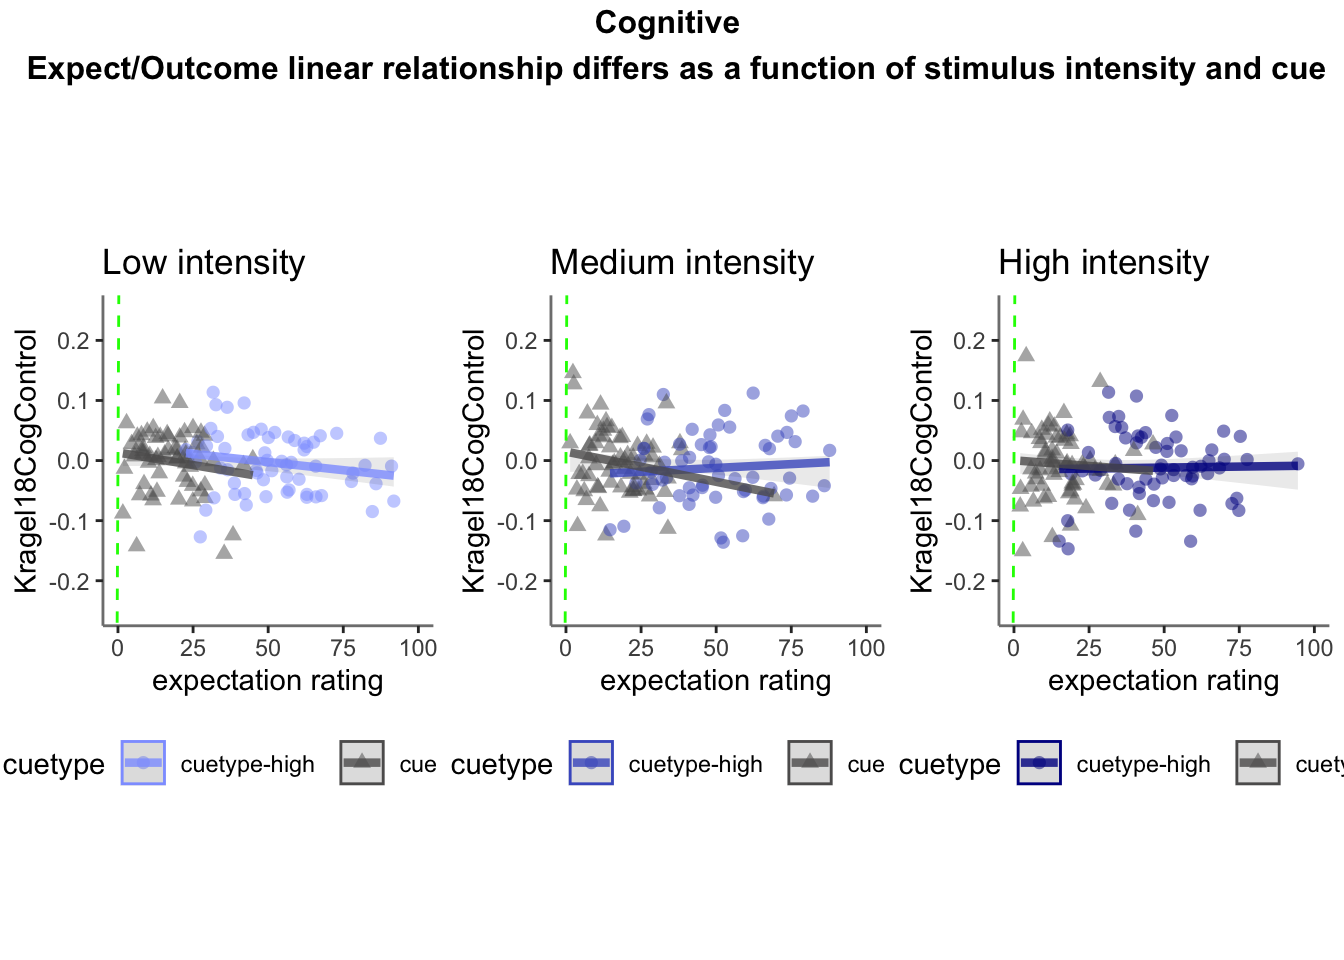
28.2.3 2 Cue x 3 Stimulus intensity x Expectation rating
model.cog3factor <- lmer(Kragel18CogControl ~ CUE_high_gt_low*stim_con_linear*event02_expect_angle + CUE_high_gt_low*stim_con_quad*event02_expect_angle + (CUE_high_gt_low|sub), data = data_screen)## boundary (singular) fit: see help('isSingular')sjPlot::tab_model(model.cog3factor)| Kragel18CogControl | |||
|---|---|---|---|
| Predictors | Estimates | CI | p |
| (Intercept) | -0.01 | -0.02 – 0.01 | 0.267 |
| CUE high gt low | -0.01 | -0.02 – -0.00 | 0.045 |
| stim con linear | -0.03 | -0.04 – -0.01 | <0.001 |
| event02 expect angle | -0.00 | -0.00 – 0.00 | 0.615 |
| stim con quad | -0.01 | -0.02 – 0.00 | 0.065 |
|
CUE high gt low * stim con linear |
-0.03 | -0.05 – -0.00 | 0.048 |
|
CUE high gt low * event02 expect angle |
0.00 | -0.00 – 0.00 | 0.107 |
|
stim con linear * event02 expect angle |
0.00 | -0.00 – 0.00 | 0.144 |
|
CUE high gt low * stim con quad |
-0.02 | -0.04 – 0.00 | 0.107 |
|
event02 expect angle * stim con quad |
0.00 | -0.00 – 0.00 | 0.255 |
|
(CUE high gt low * stim con linear) * event02 expect angle |
0.00 | -0.00 – 0.00 | 0.173 |
|
(CUE high gt low event02 expect angle) stim con quad |
0.00 | -0.00 – 0.00 | 0.527 |
| Random Effects | |||
| σ2 | 0.01 | ||
| τ00 sub | 0.00 | ||
| τ11 sub.CUE_high_gt_low | 0.00 | ||
| ρ01 sub | 1.00 | ||
| N sub | 70 | ||
| Observations | 2657 | ||
| Marginal R2 / Conditional R2 | 0.011 / NA | ||
kableExtra::kable_styling(
  knitr::kable(
    eta_squared(model.cog3factor, partial = TRUE), # MODIFY
"html"), "striped", position = "left", font_size = 12)| Parameter | Eta2_partial | CI | CI_low | CI_high |
|---|---|---|---|---|
| CUE_high_gt_low | 0.0034828 | 0.95 | 0.0000433 | 1 |
| stim_con_linear | 0.0057816 | 0.95 | 0.0019197 | 1 |
| event02_expect_angle | 0.0000993 | 0.95 | 0.0000000 | 1 |
| stim_con_quad | 0.0013129 | 0.95 | 0.0000000 | 1 |
| CUE_high_gt_low:stim_con_linear | 0.0015124 | 0.95 | 0.0000074 | 1 |
| CUE_high_gt_low:event02_expect_angle | 0.0010157 | 0.95 | 0.0000000 | 1 |
| stim_con_linear:event02_expect_angle | 0.0008253 | 0.95 | 0.0000000 | 1 |
| CUE_high_gt_low:stim_con_quad | 0.0010038 | 0.95 | 0.0000000 | 1 |
| event02_expect_angle:stim_con_quad | 0.0005007 | 0.95 | 0.0000000 | 1 |
| CUE_high_gt_low:stim_con_linear:event02_expect_angle | 0.0007171 | 0.95 | 0.0000000 | 1 |
| CUE_high_gt_low:event02_expect_angle:stim_con_quad | 0.0001548 | 0.95 | 0.0000000 | 1 |
kableExtra::kable_styling(
  knitr::kable(
    lme.dscore(model.cog3factor, data_screen, type = "lme4"), # MODIFY
    "html"), "striped", position = "left", font_size = 12)
## boundary (singular) fit: see help('isSingular')| t | df | d | |
|---|---|---|---|
| CUE_high_gt_low | -2.0101599 | 1156.158 | -0.1182366 |
| stim_con_linear | -3.8777185 | 2585.733 | -0.1525157 |
| event02_expect_angle | -0.5035855 | 2554.118 | -0.0199289 |
| stim_con_quad | -1.8432482 | 2584.370 | -0.0725164 |
| CUE_high_gt_low:stim_con_linear | -1.9794942 | 2586.972 | -0.0778374 |
| CUE_high_gt_low:event02_expect_angle | 1.6115221 | 2554.318 | 0.0637718 |
| stim_con_linear:event02_expect_angle | 1.4616274 | 2586.346 | 0.0574809 |
| CUE_high_gt_low:stim_con_quad | -1.6118631 | 2585.596 | -0.0633983 |
| event02_expect_angle:stim_con_quad | 1.1383984 | 2586.764 | 0.0447658 |
| CUE_high_gt_low:stim_con_linear:event02_expect_angle | 1.3623712 | 2586.508 | 0.0535758 |
| CUE_high_gt_low:event02_expect_angle:stim_con_quad | 0.6328144 | 2586.438 | 0.0248860 |
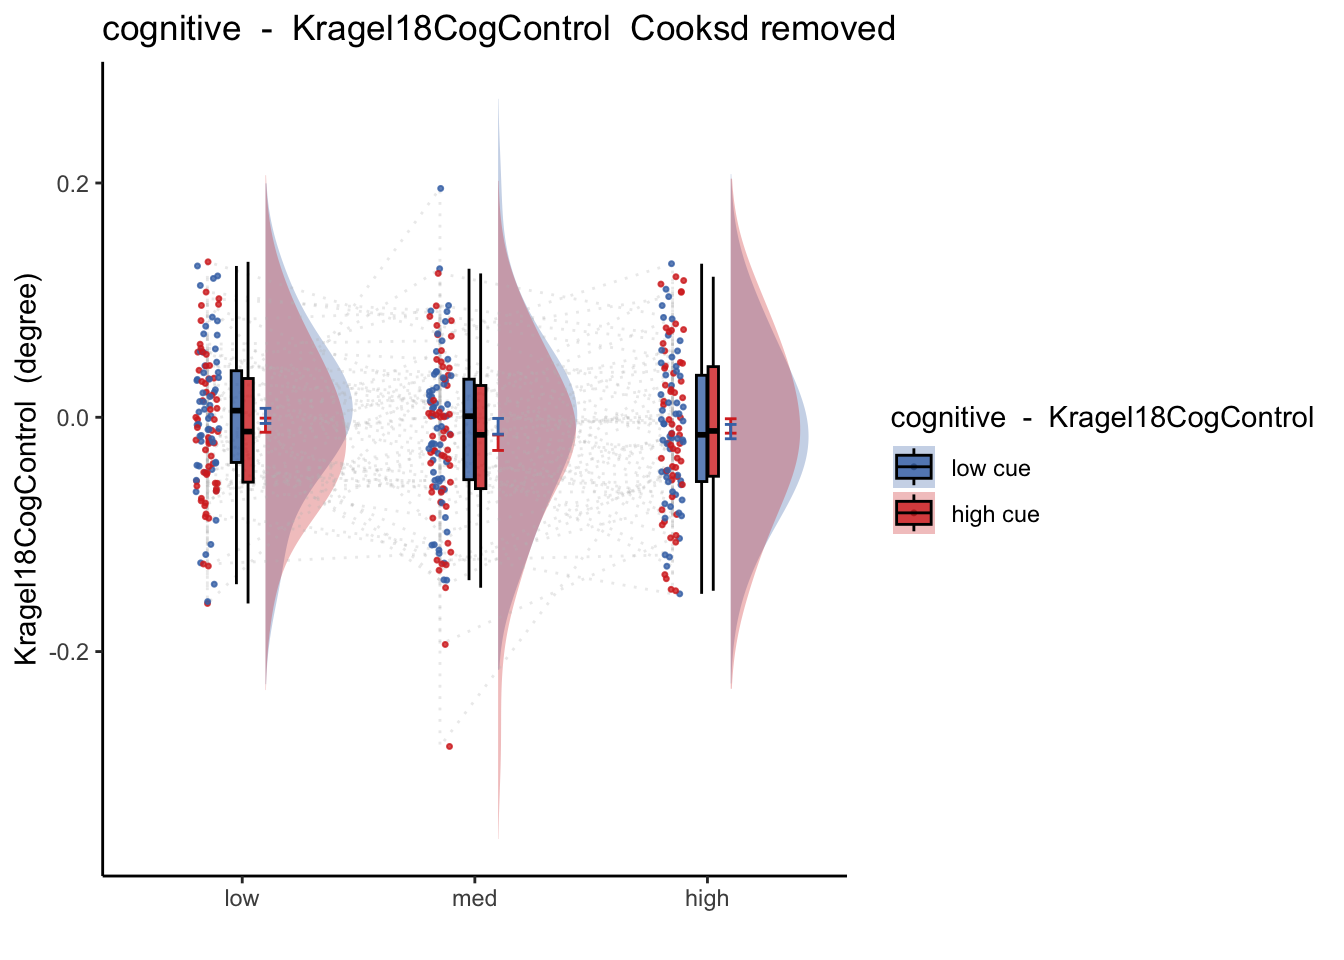
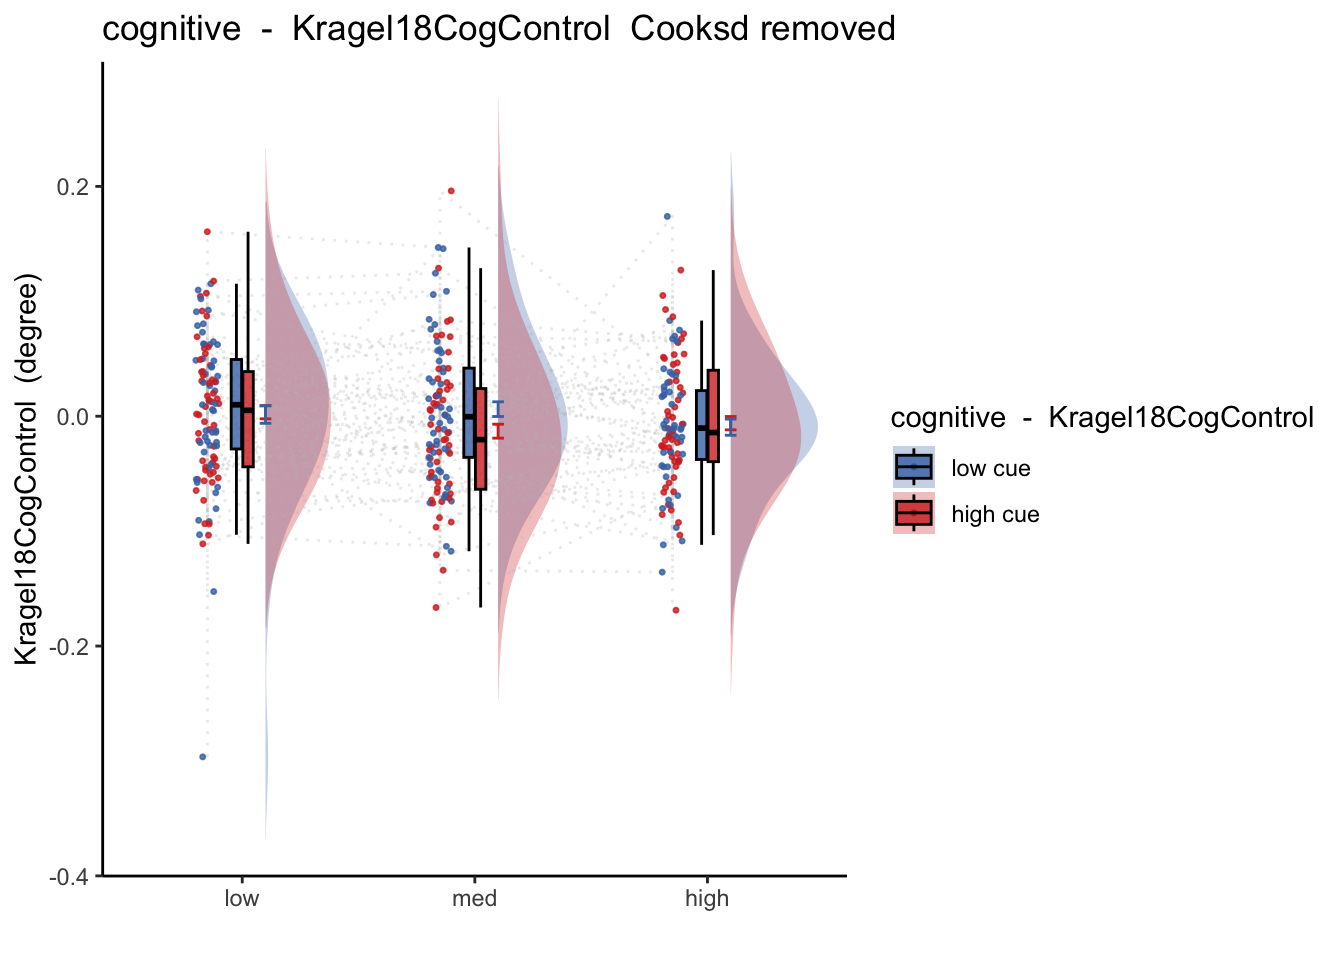
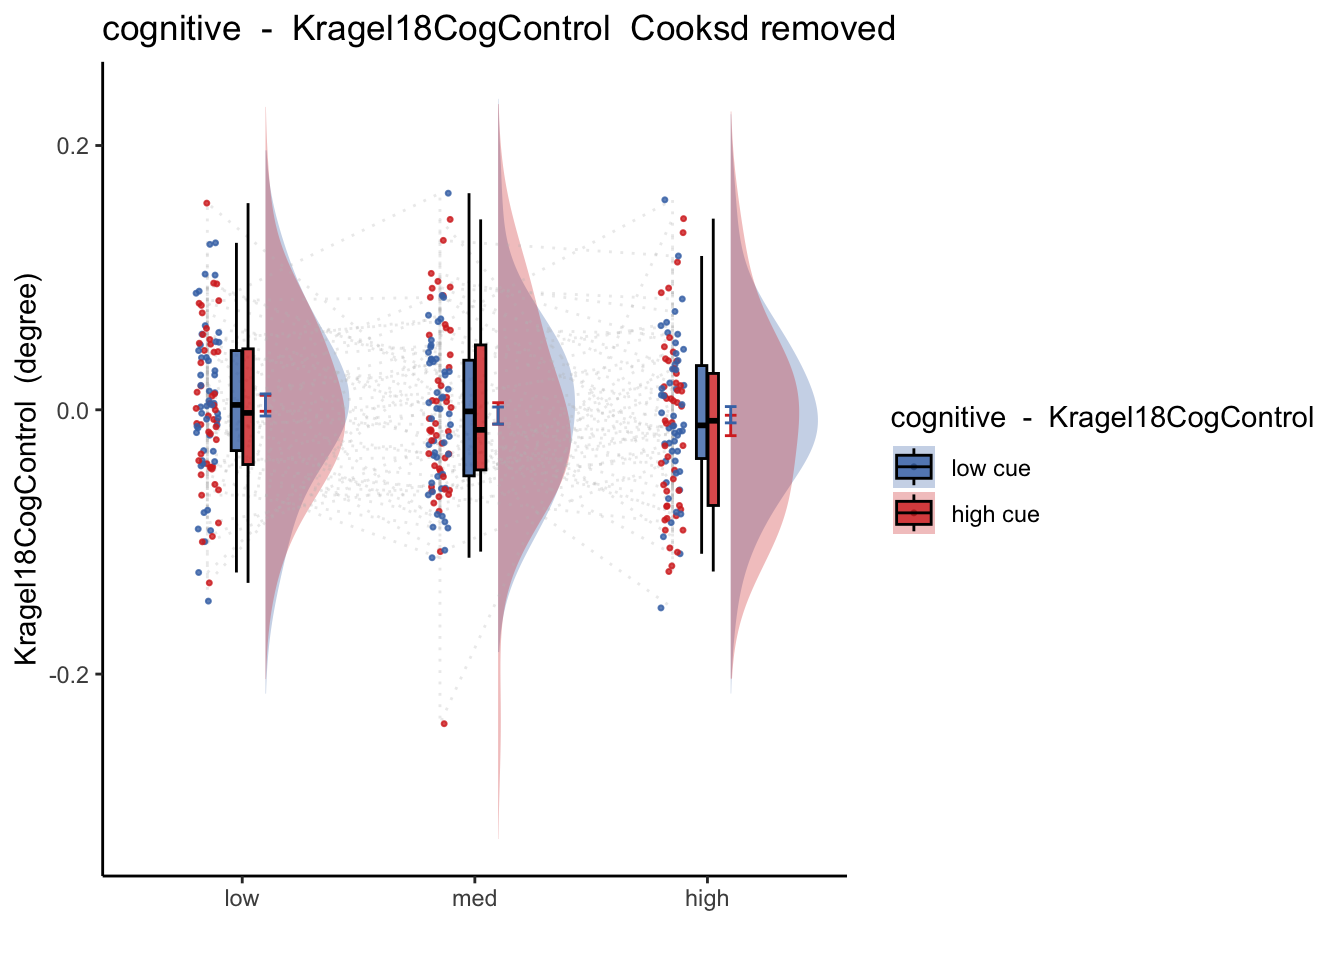
## Warning: Ignoring 86 observations28.3 Kragel2018 ~ session * cue * stimulus_intensity
Q. Is the cue effect on Cognitive signature different across sessions? (Vicarious task only)
Quick answer: Yes, the cue effect in session 1 (for medium intensity group) is significantly different; low cues lead to higher similarity between the Cog-control brain maps. Howevere, this difference becomes non significant in session 4.