Chapter 27 [fMRI] VPS ~ singletrial
author: "Heejung Jung
date: "2023-03-23"
What is the purpose of this notebook?
- Here, I model vPS dot products as a function of cue, stimulus intensity and expectation ratings.
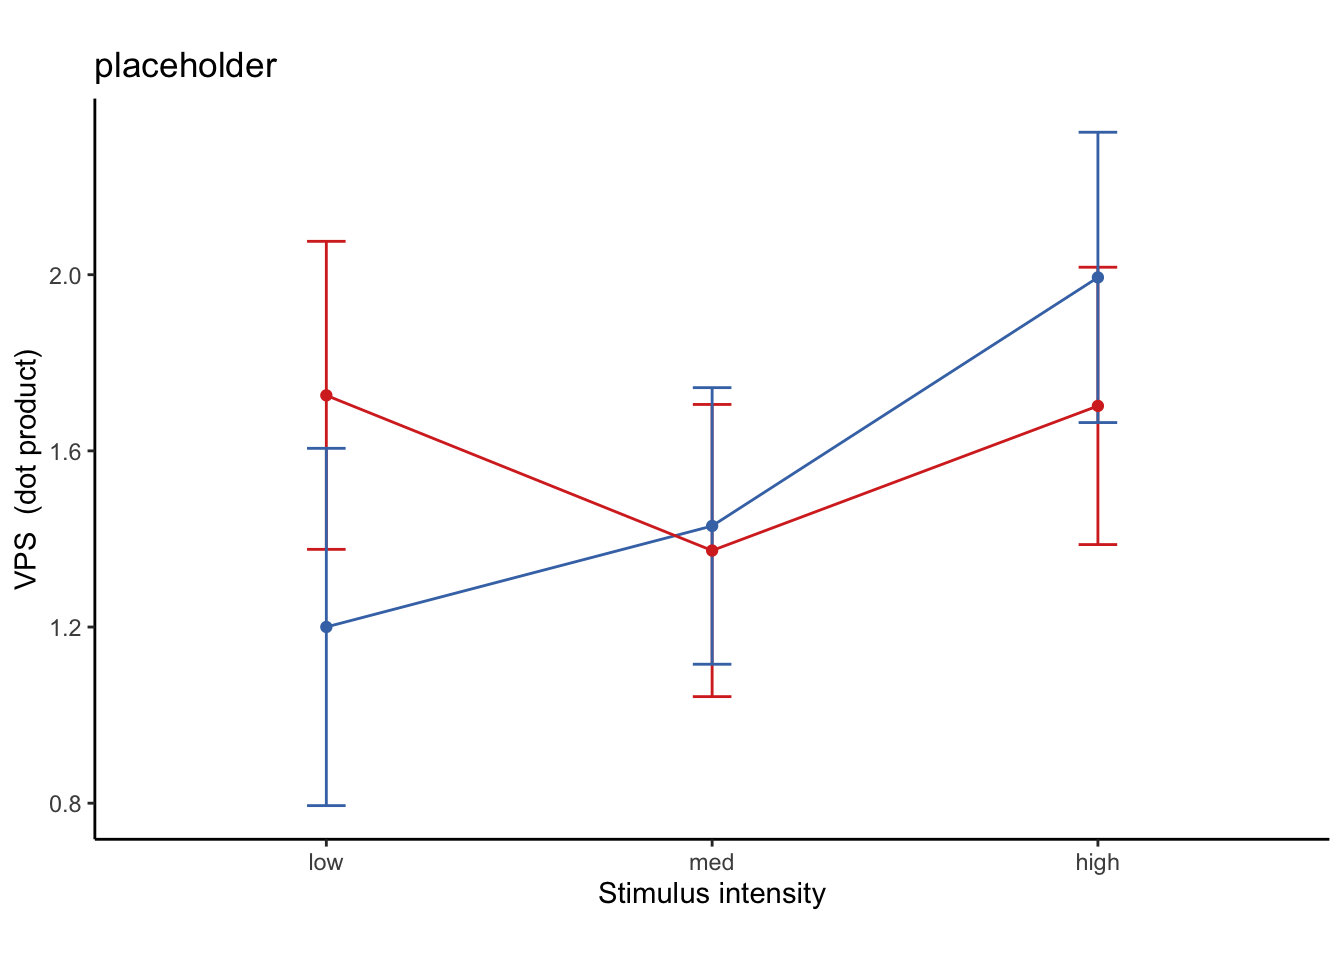
- One of the findings is that low cues lead to higher VPS dotproducts in the high intensity group, and that this effect becomes non-significant across sessions.
- 03/23/2023: For now, I’m grabbing participants that have complete data, i.e. 18 runs, all three sessions. N = 65
## [1] "/Users/h/Dropbox (Dartmouth College)/projects_dropbox/social_influence_analysis/analysis/fmri/nilearn/signature_extract/signature-VPS_sub-all_runtype-pvc_event-stimulus.tsv"27.1 VPS ~ 3 task * 3 stimulus_intensity
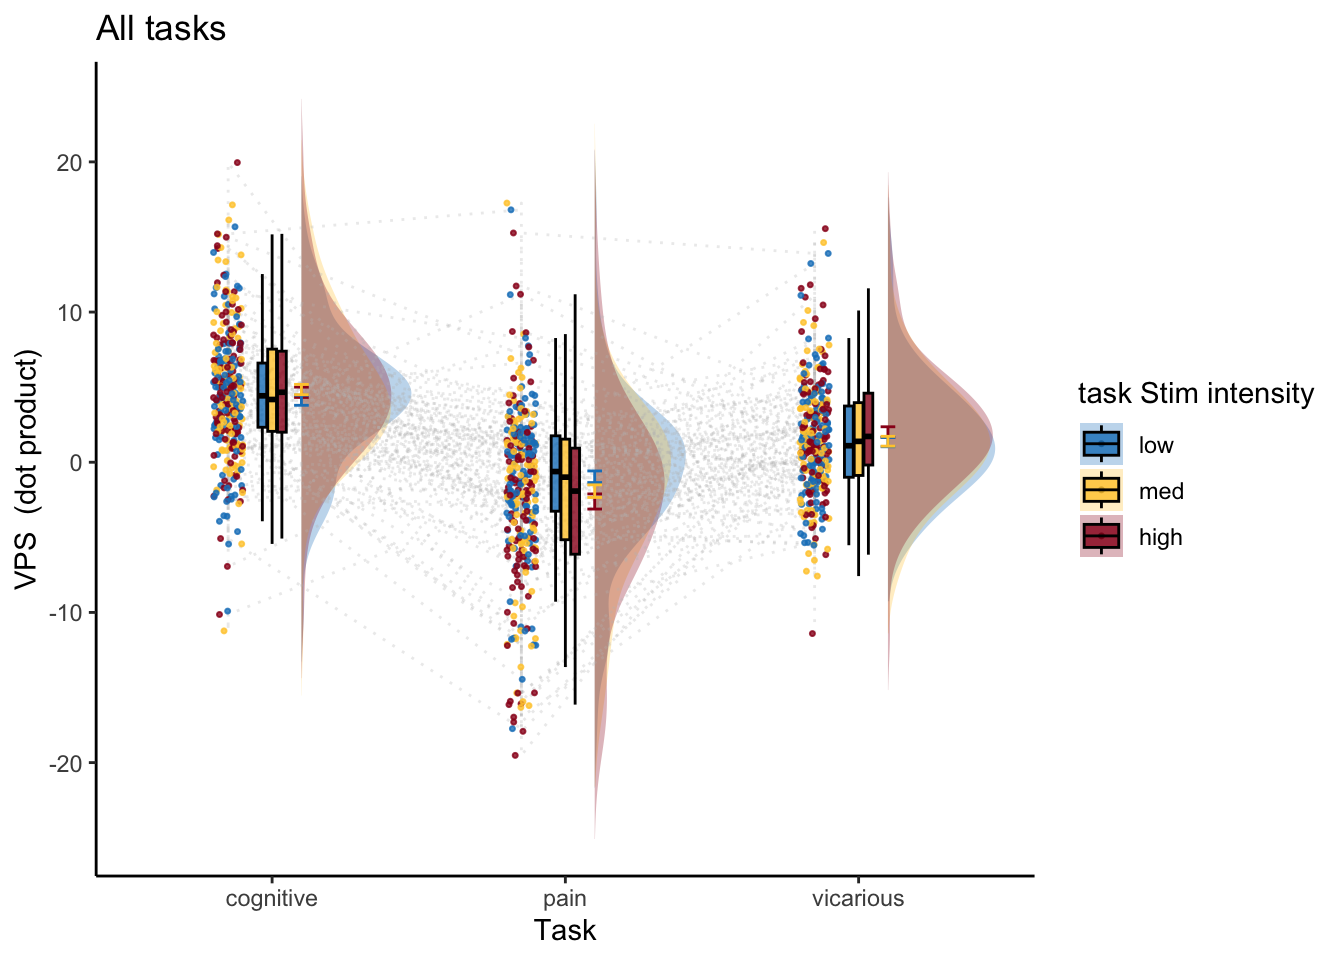
Q. What does the VPS pattern look like for the three tasks?
model.alltask <-
  lmer(VPS ~ task_con_linear*stim_factor +
         task_con_quad*stim_factor + (task|sub), data = pvc)
sjPlot::tab_model(model.alltask)| VPS | |||
|---|---|---|---|
| Predictors | Estimates | CI | p |
| (Intercept) | 1.24 | 0.65 – 1.83 | <0.001 |
| task con linear | -5.30 | -7.15 – -3.46 | <0.001 |
| stim factor [low] | 0.29 | -0.01 – 0.59 | 0.056 |
| stim factor [med] | 0.23 | -0.07 – 0.53 | 0.136 |
| task con quad | -2.11 | -3.90 – -0.32 | 0.021 |
|
task con linear * stim factor [low] |
-0.59 | -2.02 – 0.84 | 0.421 |
|
task con linear * stim factor [med] |
-1.54 | -2.98 – -0.11 | 0.035 |
|
stim factor [low] * task con quad |
2.61 | 1.36 – 3.87 | <0.001 |
|
stim factor [med] * task con quad |
2.21 | 0.96 – 3.46 | 0.001 |
| Random Effects | |||
| σ2 | 74.67 | ||
| τ00 sub | 16.59 | ||
| τ11 sub.taskpain | 35.89 | ||
| τ11 sub.taskvicarious | 16.74 | ||
| ρ01 | -0.51 | ||
| -0.68 | |||
| ICC | 0.18 | ||
| N sub | 111 | ||
| Observations | 19428 | ||
| Marginal R2 / Conditional R2 | 0.072 / 0.241 | ||
eta-squared
| Parameter | Eta2_partial | CI | CI_low | CI_high |
|---|---|---|---|---|
| task_con_linear | 0.3266266 | 0.95 | 0.2104200 | 1 |
| stim_factor | 0.0002117 | 0.95 | 0.0000000 | 1 |
| task_con_quad | 0.0034213 | 0.95 | 0.0000000 | 1 |
| task_con_linear:stim_factor | 0.0002379 | 0.95 | 0.0000000 | 1 |
| stim_factor:task_con_quad | 0.0010135 | 0.95 | 0.0003561 | 1 |
Cohen’s d
| t | df | d | |
|---|---|---|---|
| task_con_linear | -5.6291153 | 164.6488 | -0.8773863 |
| stim_factorlow | 1.9136684 | 19090.4418 | 0.0277006 |
| stim_factormed | 1.4905241 | 19090.4418 | 0.0215755 |
| task_con_quad | -2.3069934 | 148.6413 | -0.3784483 |
| task_con_linear:stim_factorlow | -0.8050546 | 19090.4422 | -0.0116533 |
| task_con_linear:stim_factormed | -2.1116090 | 19090.4422 | -0.0305658 |
| stim_factorlow:task_con_quad | 4.0883679 | 19090.4422 | 0.0591796 |
| stim_factormed:task_con_quad | 3.4549197 | 19090.4422 | 0.0500104 |
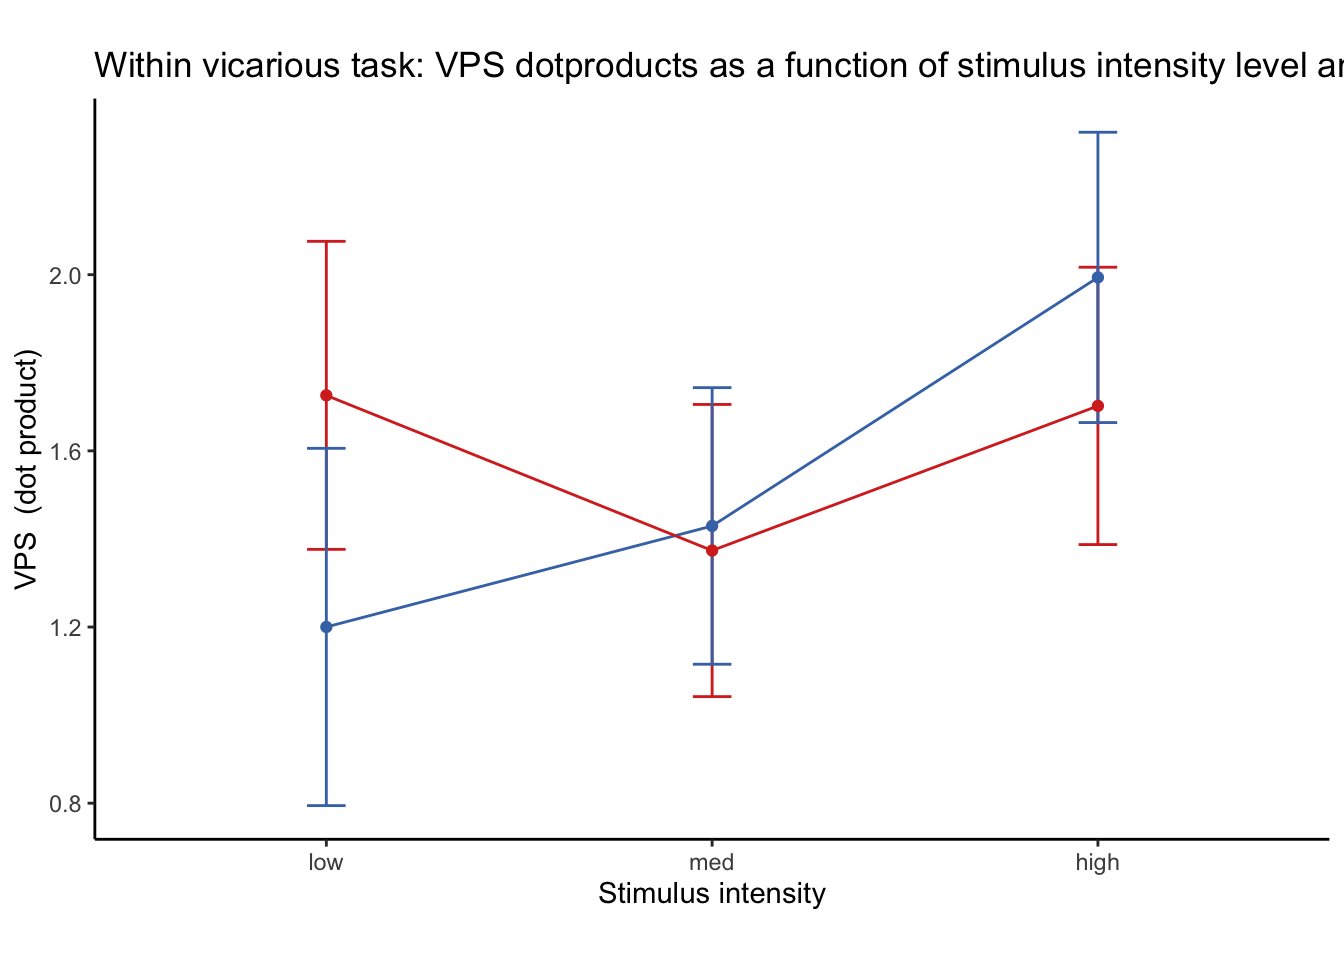
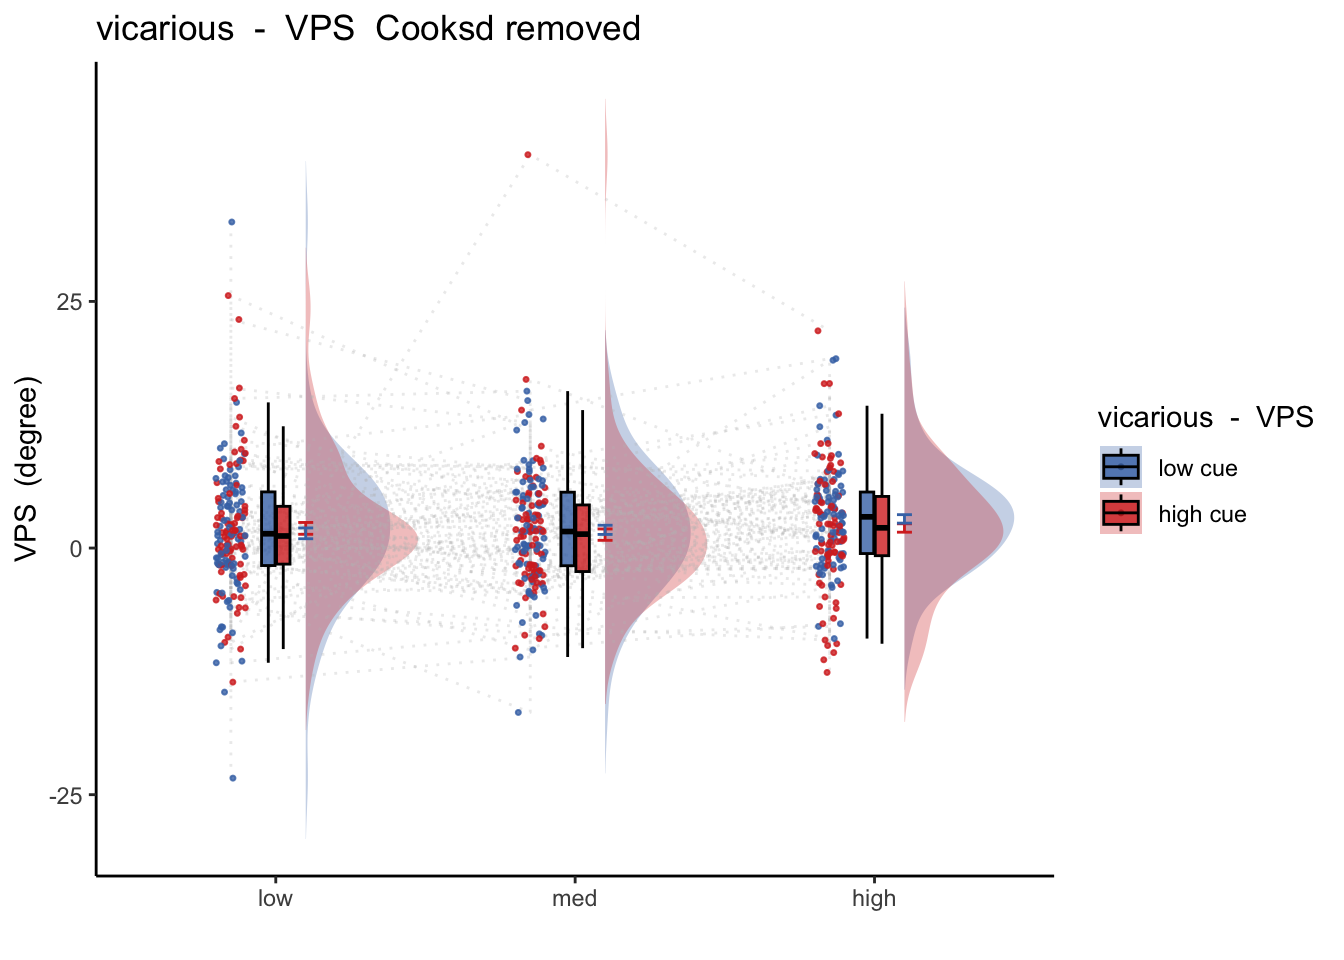
27.2 VPS ~ vicarious task: 2 cue x 3 stimulus_intensity
Q. Within vicarious task, Does stimulus intenisty level and cue level significantly predict VPS dotproducts?
27.2.1 Linear model ver 1: VPS ~ stimulus_intensity
model.vpsstim <- lmer(VPS ~ stim_con_linear + stim_con_quad +(stim_con_linear + stim_con_quad |sub), data = data_screen)
sjPlot::tab_model(model.vpsstim)| VPS | |||
|---|---|---|---|
| Predictors | Estimates | CI | p |
| (Intercept) | 1.54 | 0.83 – 2.25 | <0.001 |
| stim con linear | 0.39 | -0.18 – 0.95 | 0.180 |
| stim con quad | -0.23 | -0.72 – 0.27 | 0.370 |
| Random Effects | |||
| σ2 | 55.74 | ||
| τ00 sub | 12.05 | ||
| τ11 sub.stim_con_linear | 0.65 | ||
| τ11 sub.stim_con_quad | 0.44 | ||
| ρ01 | 0.56 | ||
| -0.18 | |||
| N sub | 104 | ||
| Observations | 4420 | ||
| Marginal R2 / Conditional R2 | 0.001 / NA | ||
27.2.2 Linear model ver 2: VPS ~ stimulus_intenisy * cue
model.vpscuestim <- lmer(VPS ~ cue_con*stim_con_linear + cue_con*stim_con_quad + (cue_con+stim_factor|sub), data = data_screen)
sjPlot::tab_model(model.vpscuestim)| VPS | |||
|---|---|---|---|
| Predictors | Estimates | CI | p |
| (Intercept) | 1.54 | 0.83 – 2.25 | <0.001 |
| cue con | 0.08 | -0.36 – 0.53 | 0.709 |
| stim con linear | 0.39 | -0.18 – 0.95 | 0.179 |
| stim con quad | -0.23 | -0.72 – 0.27 | 0.369 |
| cue con * stim con linear | 0.03 | -1.05 – 1.10 | 0.961 |
| cue con * stim con quad | -0.09 | -1.03 – 0.86 | 0.858 |
| Random Effects | |||
| σ2 | 55.78 | ||
| τ00 sub | 14.25 | ||
| τ11 sub.cue_con | 0.02 | ||
| τ11 sub.stim_factorlow | 0.66 | ||
| τ11 sub.stim_factormed | 1.08 | ||
| ρ01 | 0.97 | ||
| -0.67 | |||
| -0.47 | |||
| N sub | 104 | ||
| Observations | 4420 | ||
| Marginal R2 / Conditional R2 | 0.001 / NA | ||
Linear model ver 2: eta-squared
| Parameter | Eta2_partial | CI | CI_low | CI_high |
|---|---|---|---|---|
| cue_con | 0.0000478 | 0.95 | 0 | 1 |
| stim_con_linear | 0.0116418 | 0.95 | 0 | 1 |
| stim_con_quad | 0.0057814 | 0.95 | 0 | 1 |
| cue_con:stim_con_linear | 0.0000006 | 0.95 | 0 | 1 |
| cue_con:stim_con_quad | 0.0000076 | 0.95 | 0 | 1 |
Cohen’s d: VPS stimulus intensity d = 0.217, cue level d = 0.013
| t | df | d | |
|---|---|---|---|
| cue_con | 0.3735172 | 2920.3096 | 0.0138238 |
| stim_con_linear | 1.3445086 | 153.4694 | 0.2170614 |
| stim_con_quad | -0.8976592 | 138.5715 | -0.1525122 |
| cue_con:stim_con_linear | 0.0484256 | 4231.8238 | 0.0014888 |
| cue_con:stim_con_quad | -0.1789583 | 4233.5751 | -0.0055008 |
27.2.3 2 Cue x 3 Stimulus intensity x Expectation rating
model.vps3factor <- lmer(VPS ~ cue_con*stim_con_linear*event02_expect_angle + cue_con*stim_con_quad*event02_expect_angle + (cue_con|sub), data = data_screen)
sjPlot::tab_model(model.vps3factor)| VPS | |||
|---|---|---|---|
| Predictors | Estimates | CI | p |
| (Intercept) | 1.24 | 0.40 – 2.08 | 0.004 |
| cue con | -0.15 | -1.09 – 0.80 | 0.758 |
| stim con linear | 0.32 | -0.77 – 1.41 | 0.564 |
| event02 expect angle | 0.01 | -0.00 – 0.03 | 0.158 |
| stim con quad | -0.14 | -1.09 – 0.82 | 0.781 |
| cue con * stim con linear | 0.33 | -1.85 – 2.51 | 0.768 |
|
cue con * event02 expect angle |
-0.00 | -0.03 – 0.03 | 0.839 |
|
stim con linear * event02 expect angle |
0.01 | -0.02 – 0.04 | 0.624 |
| cue con * stim con quad | 0.33 | -1.58 – 2.24 | 0.738 |
|
event02 expect angle * stim con quad |
-0.01 | -0.03 – 0.02 | 0.707 |
|
(cue con * stim con linear) * event02 expect angle |
-0.02 | -0.09 – 0.05 | 0.544 |
|
(cue con * event02 expect angle) * stim con quad |
0.00 | -0.05 – 0.06 | 0.990 |
| Random Effects | |||
| σ2 | 56.38 | ||
| τ00 sub | 12.03 | ||
| τ11 sub.cue_con | 0.02 | ||
| ρ01 sub | 1.00 | ||
| N sub | 104 | ||
| Observations | 4230 | ||
| Marginal R2 / Conditional R2 | 0.002 / NA | ||
kableExtra::kable_styling(
  knitr::kable(
    eta_squared(model.vps3factor, partial = TRUE), # MODIFY
"html"), "striped", position = "left", font_size = 12)| Parameter | Eta2_partial | CI | CI_low | CI_high |
|---|---|---|---|---|
| cue_con | 0.0000281 | 0.95 | 0 | 1 |
| stim_con_linear | 0.0000805 | 0.95 | 0 | 1 |
| event02_expect_angle | 0.0005784 | 0.95 | 0 | 1 |
| stim_con_quad | 0.0000187 | 0.95 | 0 | 1 |
| cue_con:stim_con_linear | 0.0000210 | 0.95 | 0 | 1 |
| cue_con:event02_expect_angle | 0.0000121 | 0.95 | 0 | 1 |
| stim_con_linear:event02_expect_angle | 0.0000582 | 0.95 | 0 | 1 |
| cue_con:stim_con_quad | 0.0000271 | 0.95 | 0 | 1 |
| event02_expect_angle:stim_con_quad | 0.0000342 | 0.95 | 0 | 1 |
| cue_con:stim_con_linear:event02_expect_angle | 0.0000892 | 0.95 | 0 | 1 |
| cue_con:event02_expect_angle:stim_con_quad | 0.0000000 | 0.95 | 0 | 1 |
kableExtra::kable_styling(
  knitr::kable(
    lme.dscore(model.vps3factor, data_screen, type = "lme4"), # MODIFY
"html"), "striped", position = "left", font_size = 12)| t | df | d | |
|---|---|---|---|
| cue_con | -0.3079865 | 3375.733 | -0.0106017 |
| stim_con_linear | 0.5762780 | 4122.869 | 0.0179499 |
| event02_expect_angle | 1.4107477 | 3438.911 | 0.0481137 |
| stim_con_quad | -0.2776990 | 4120.037 | -0.0086527 |
| cue_con:stim_con_linear | 0.2945420 | 4124.835 | 0.0091722 |
| cue_con:event02_expect_angle | -0.2038101 | 3432.844 | -0.0069571 |
| stim_con_linear:event02_expect_angle | 0.4897779 | 4124.654 | 0.0152523 |
| cue_con:stim_con_quad | 0.3339531 | 4120.459 | 0.0104050 |
| event02_expect_angle:stim_con_quad | -0.3755729 | 4121.327 | -0.0117005 |
| cue_con:stim_con_linear:event02_expect_angle | -0.6068106 | 4126.822 | -0.0188919 |
| cue_con:event02_expect_angle:stim_con_quad | 0.0120689 | 4121.074 | 0.0003760 |
27.3 VPS ~ session * cue * stimulus_intensity
27.4 VPS ~ outcome_rating
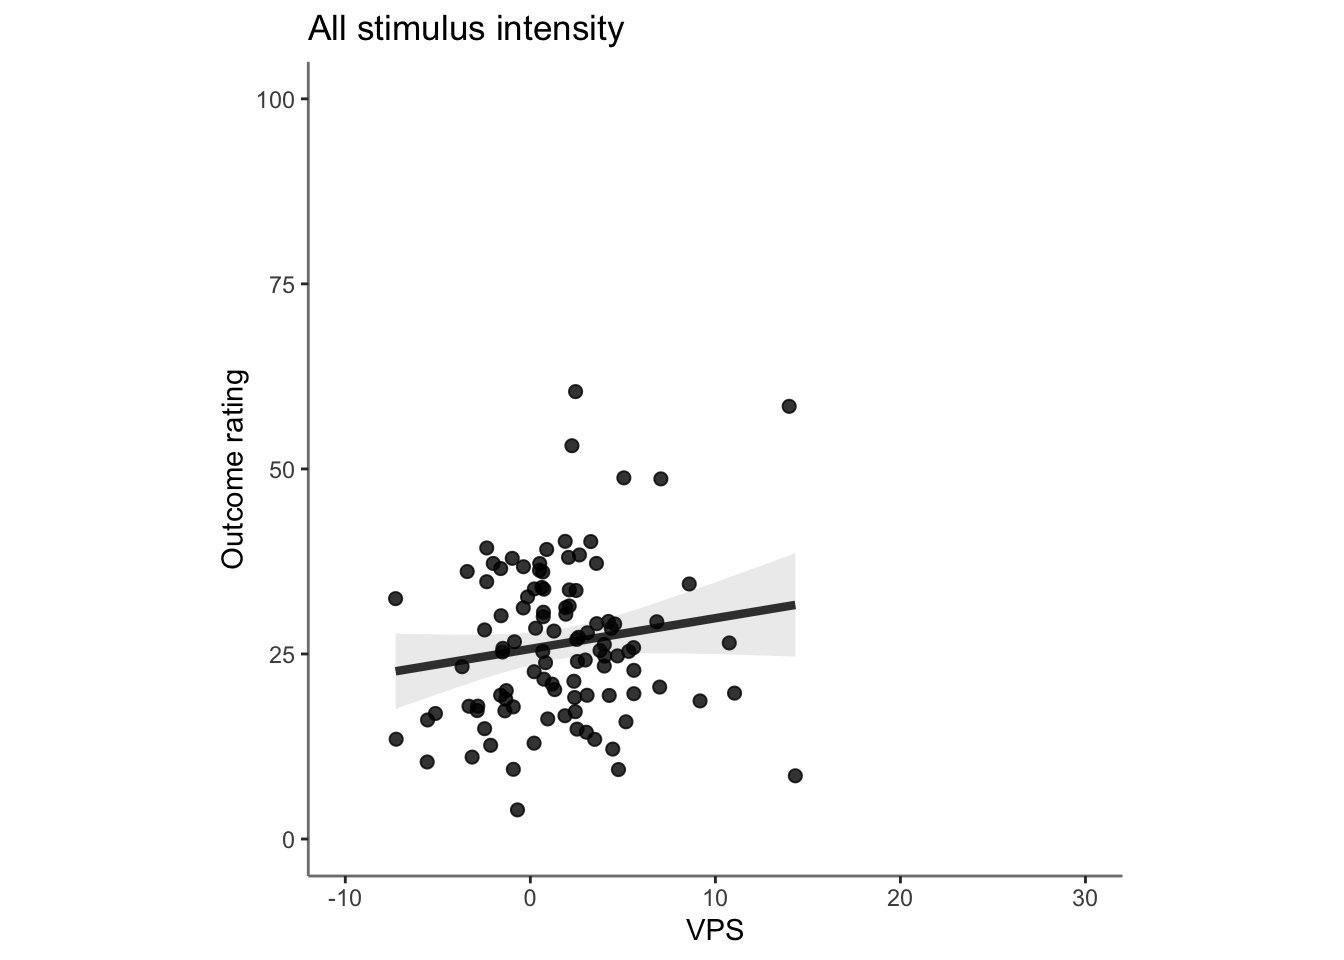
27.5 VPS ~ expectation_rating
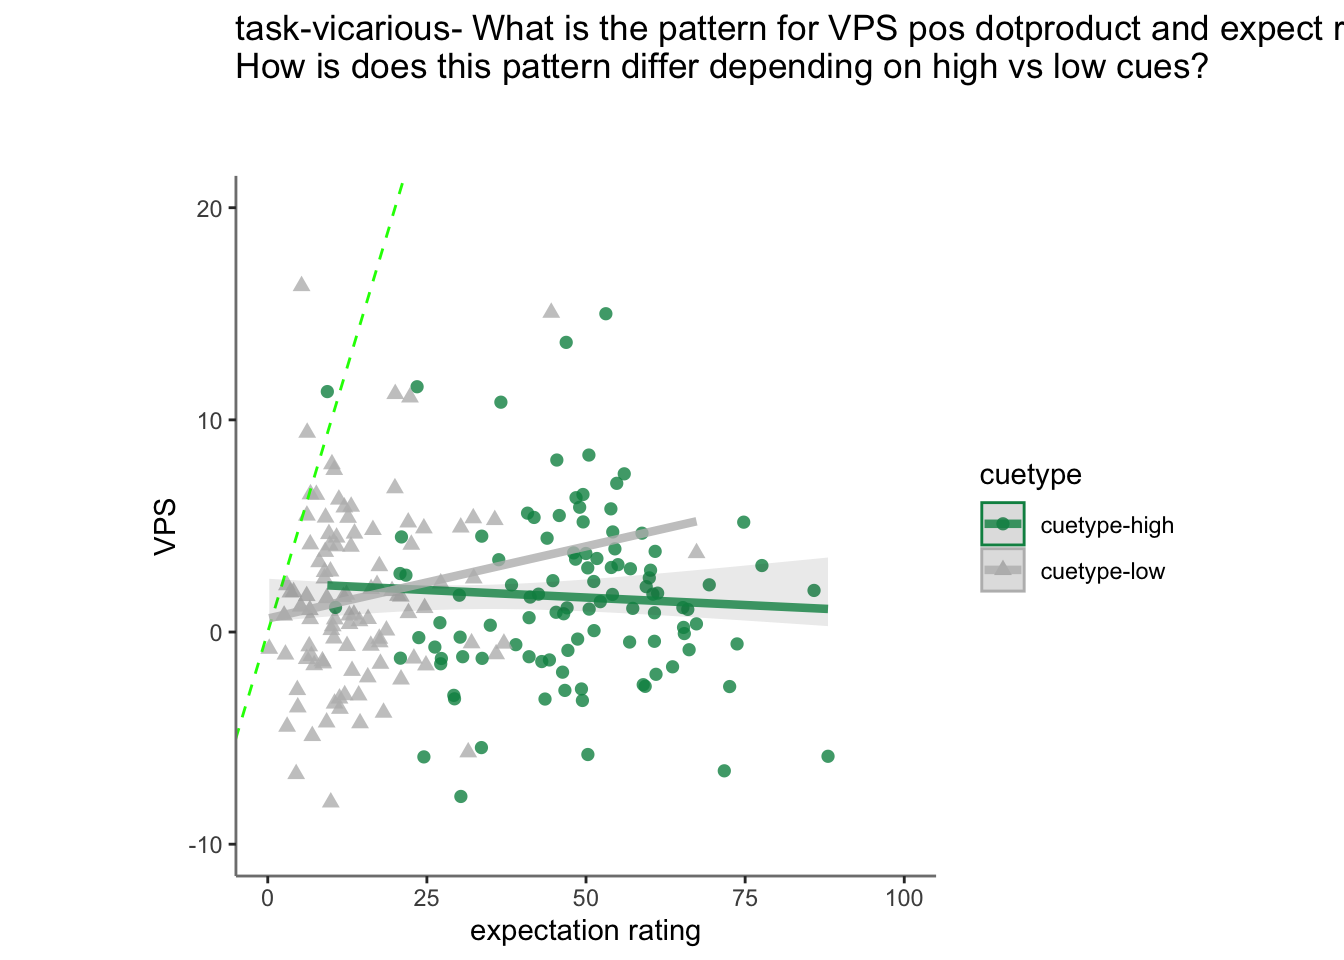
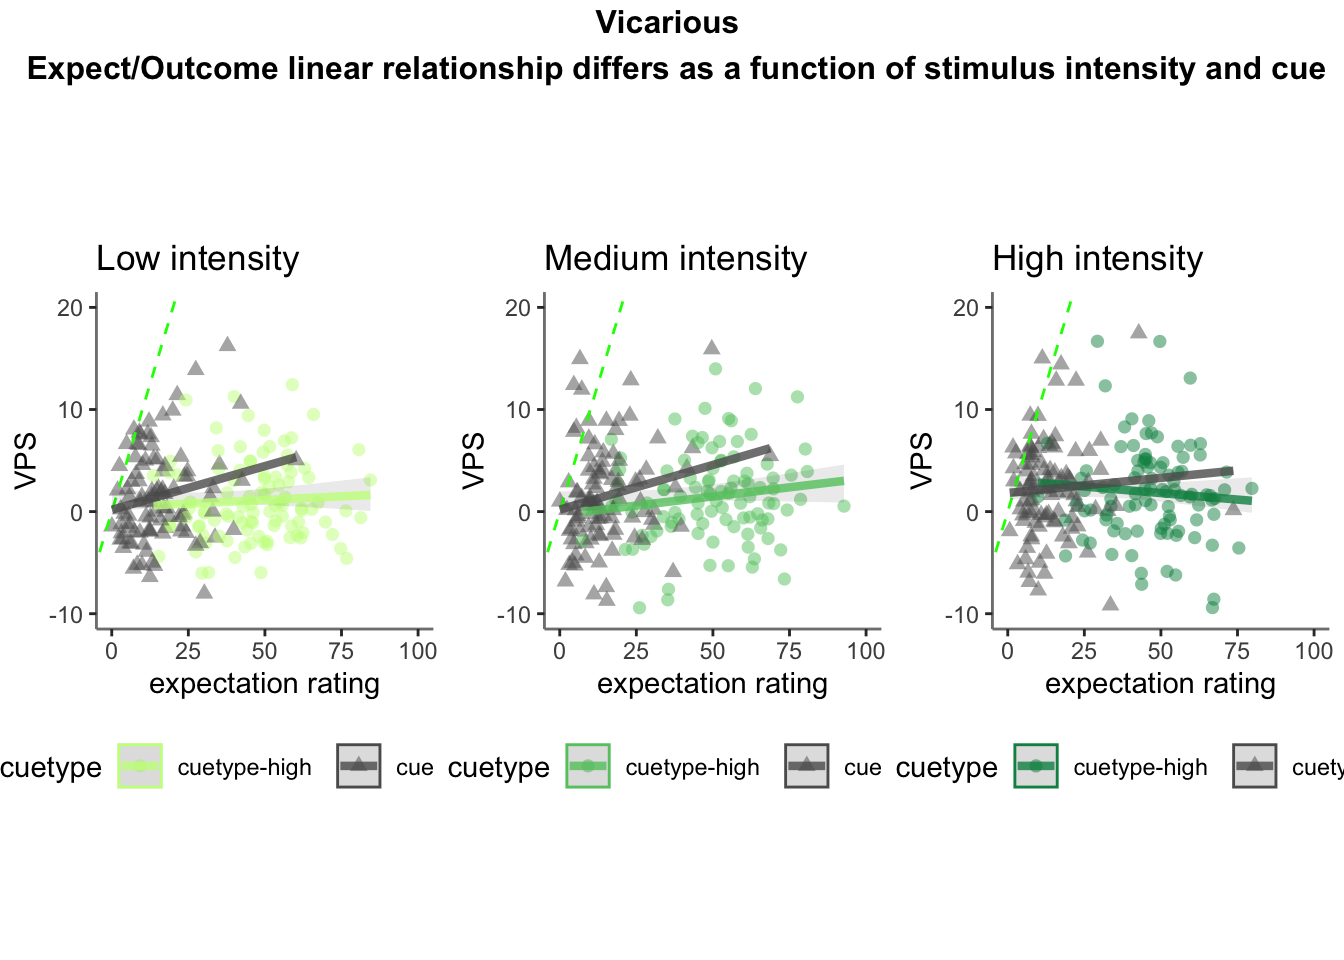
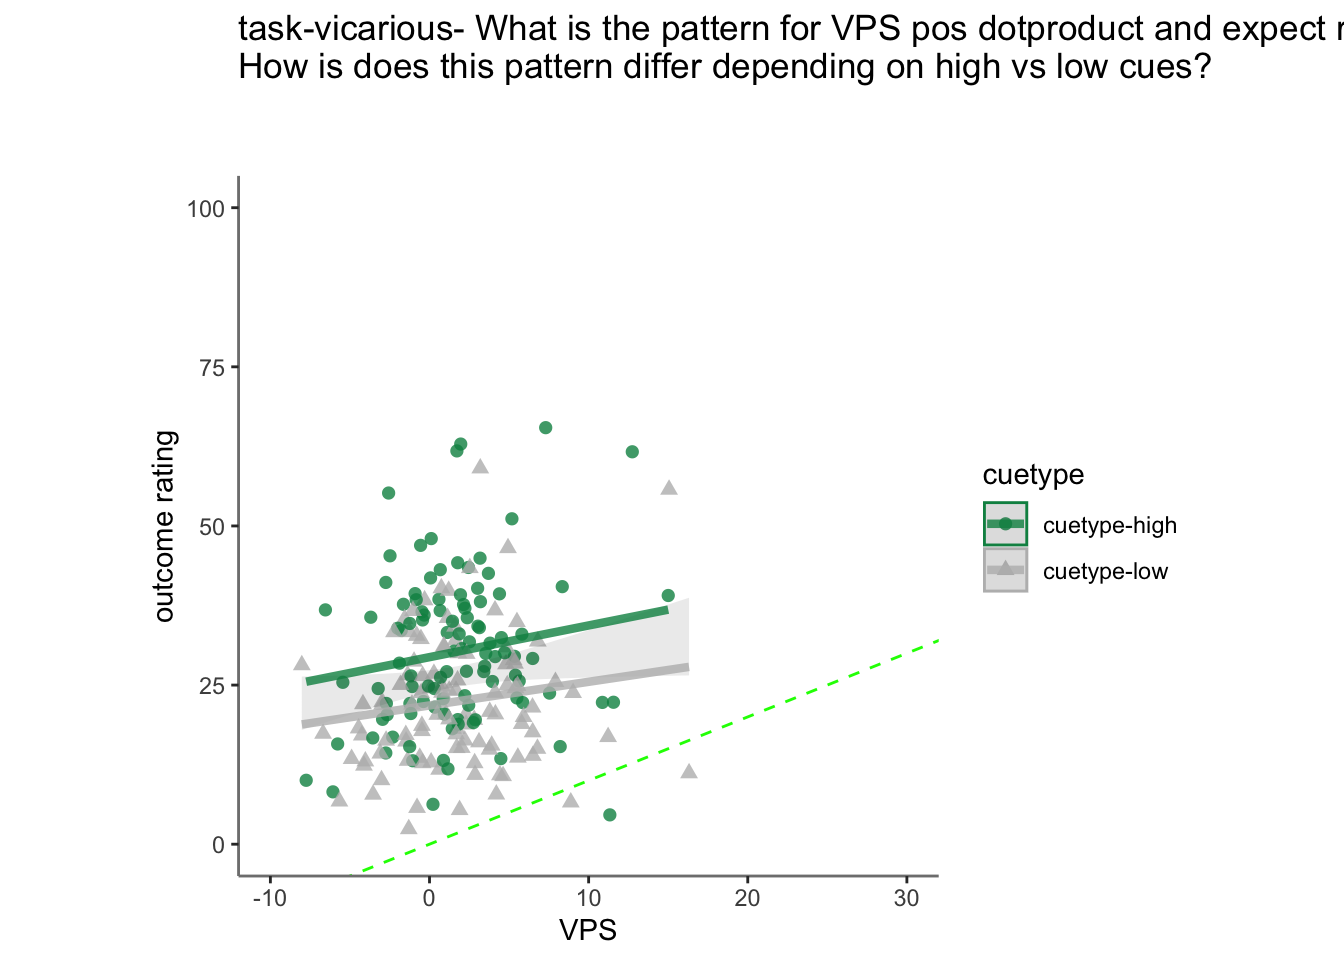
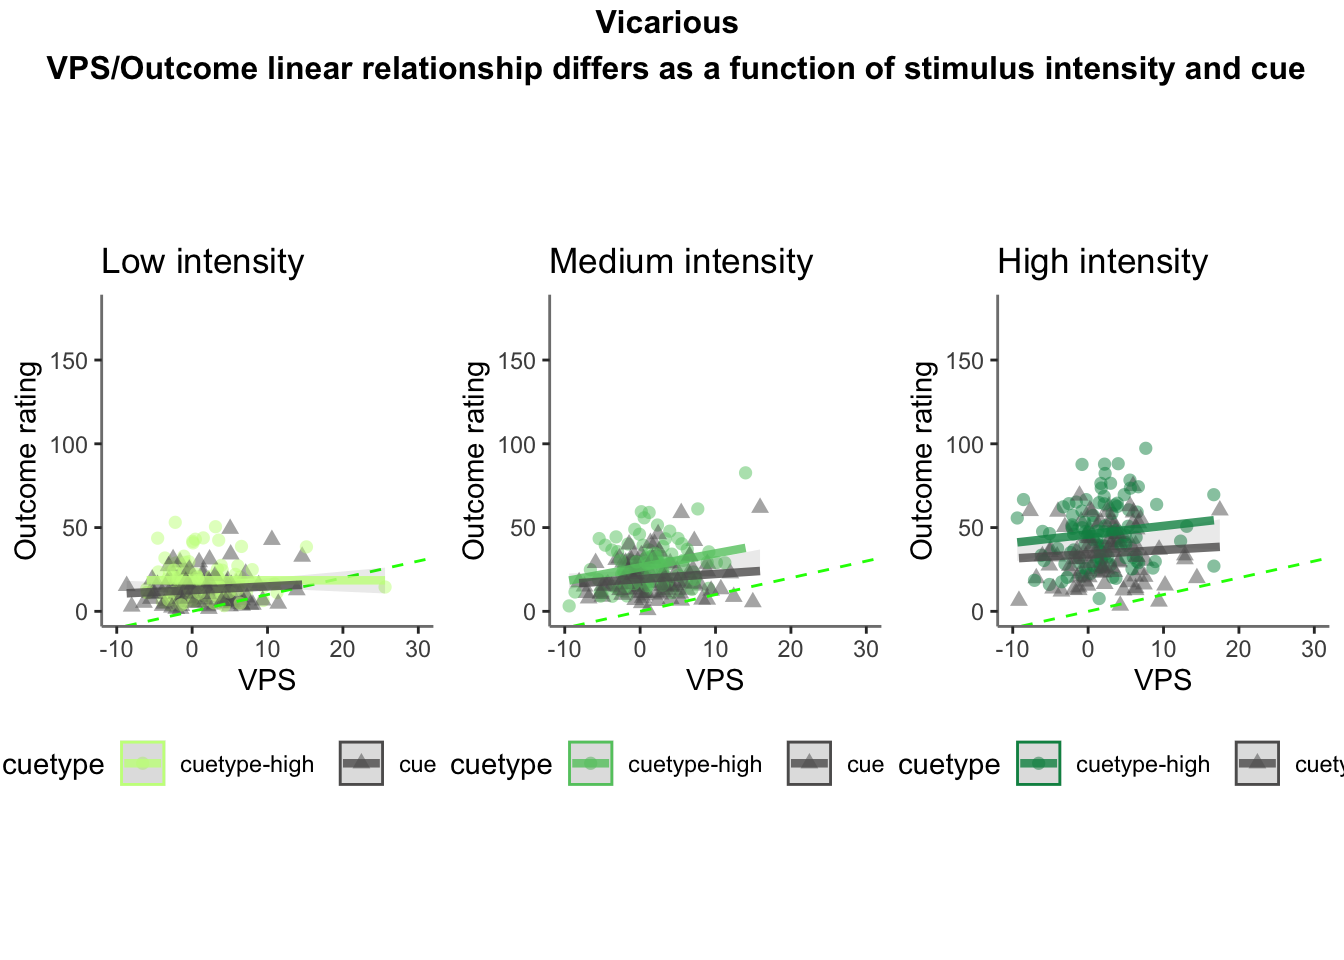
Q. What is the relationship betweeen expectation ratings & VPS? (Vicarious task only)
Do we see a linear effect between expectation rating and VPS dot products? Also, does this effect differ as a function of cue and stimulus intensity ratings, as is the case for behavioral ratings?
Quick answer: Kind of, expectation ratings predict VPS dotproducts; almost only in the low cue conditions across all stimulus intensity levels.