Chapter 18 [beh] RL simulation
What is the purpose of this notebook?
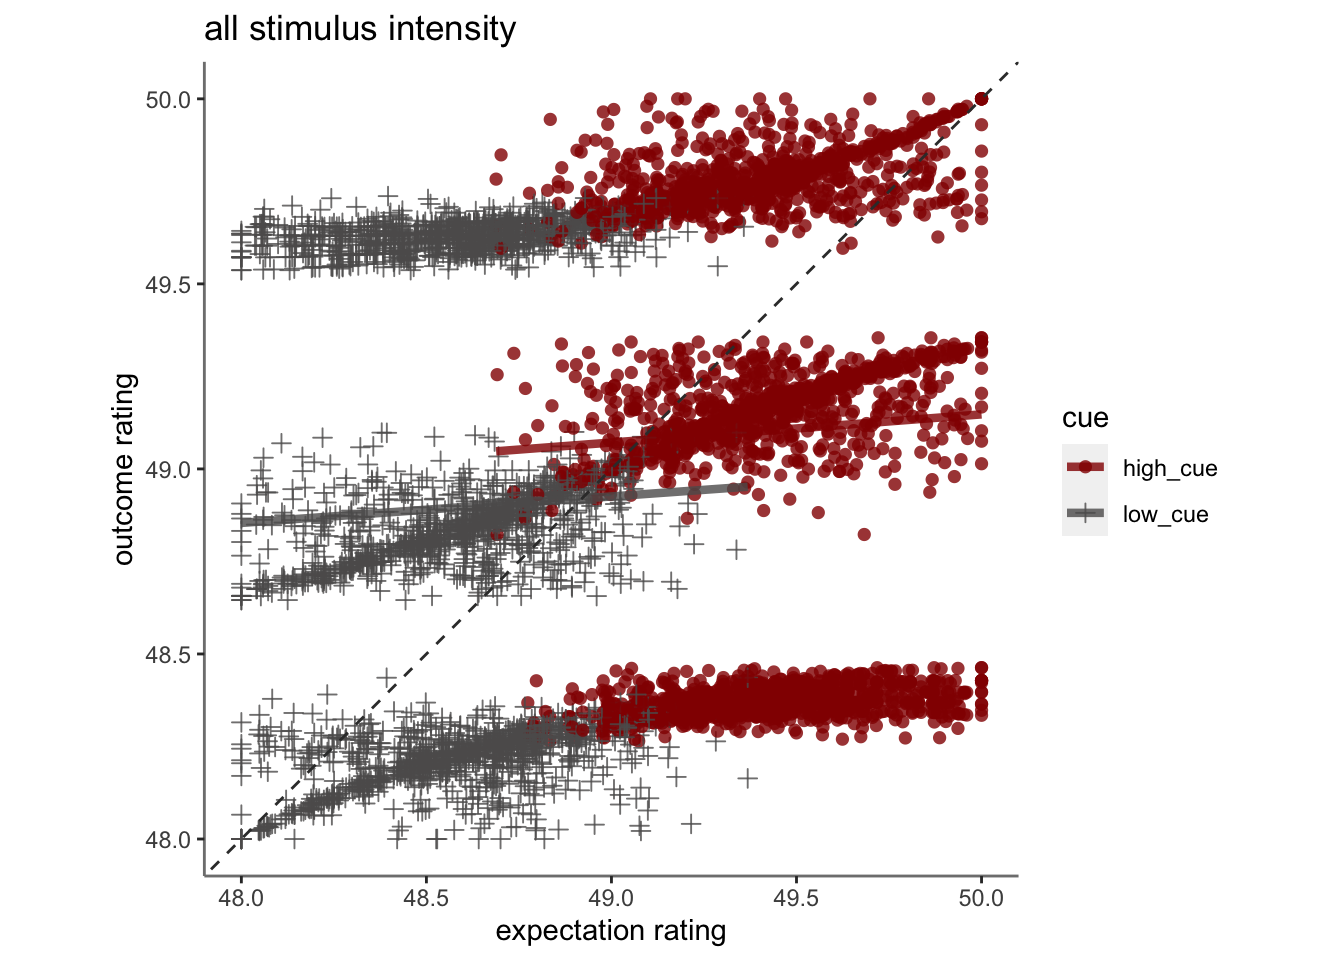
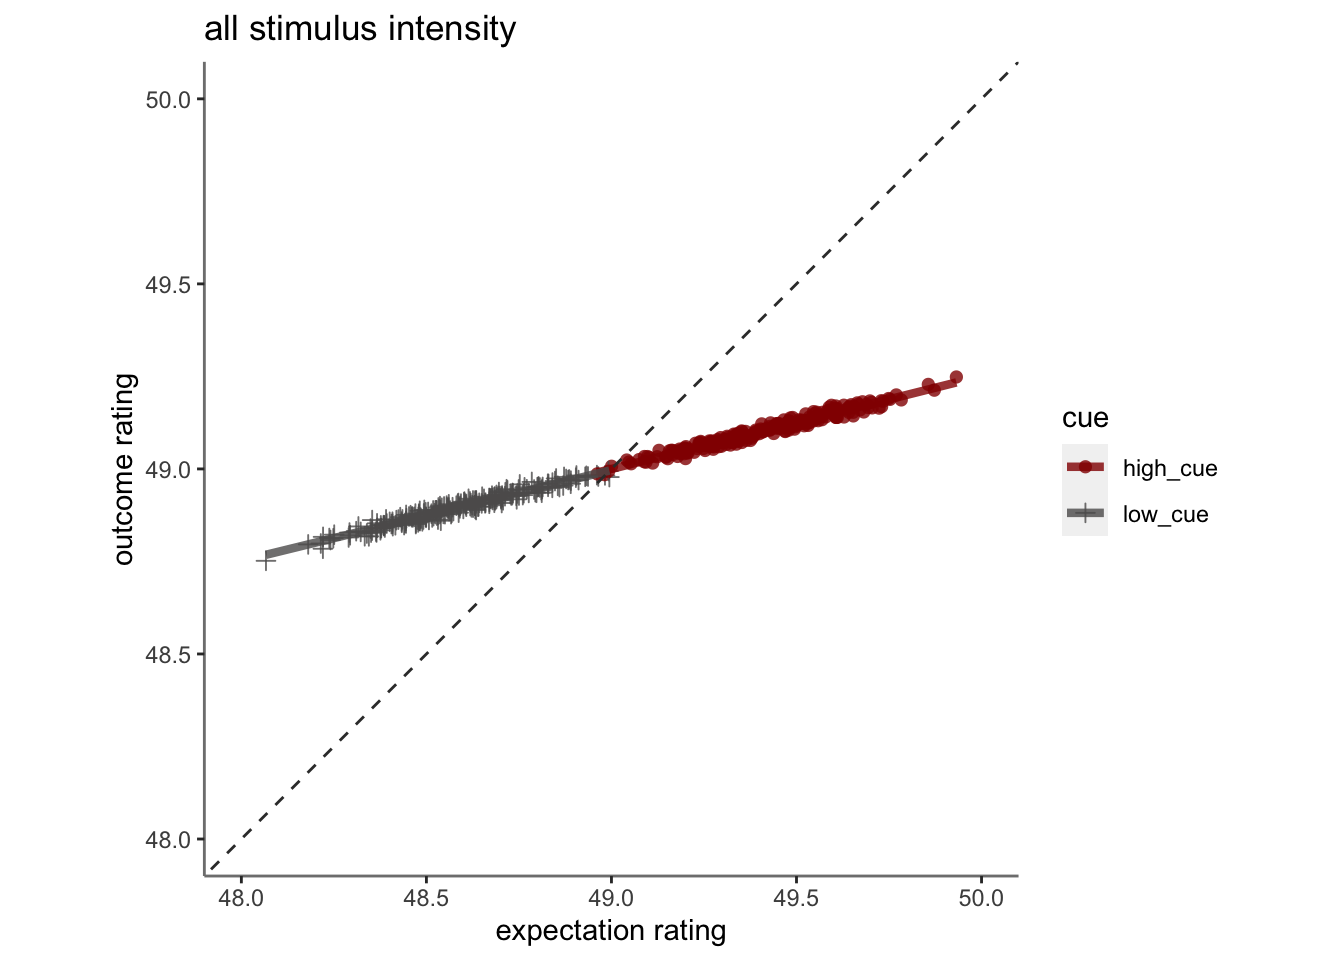
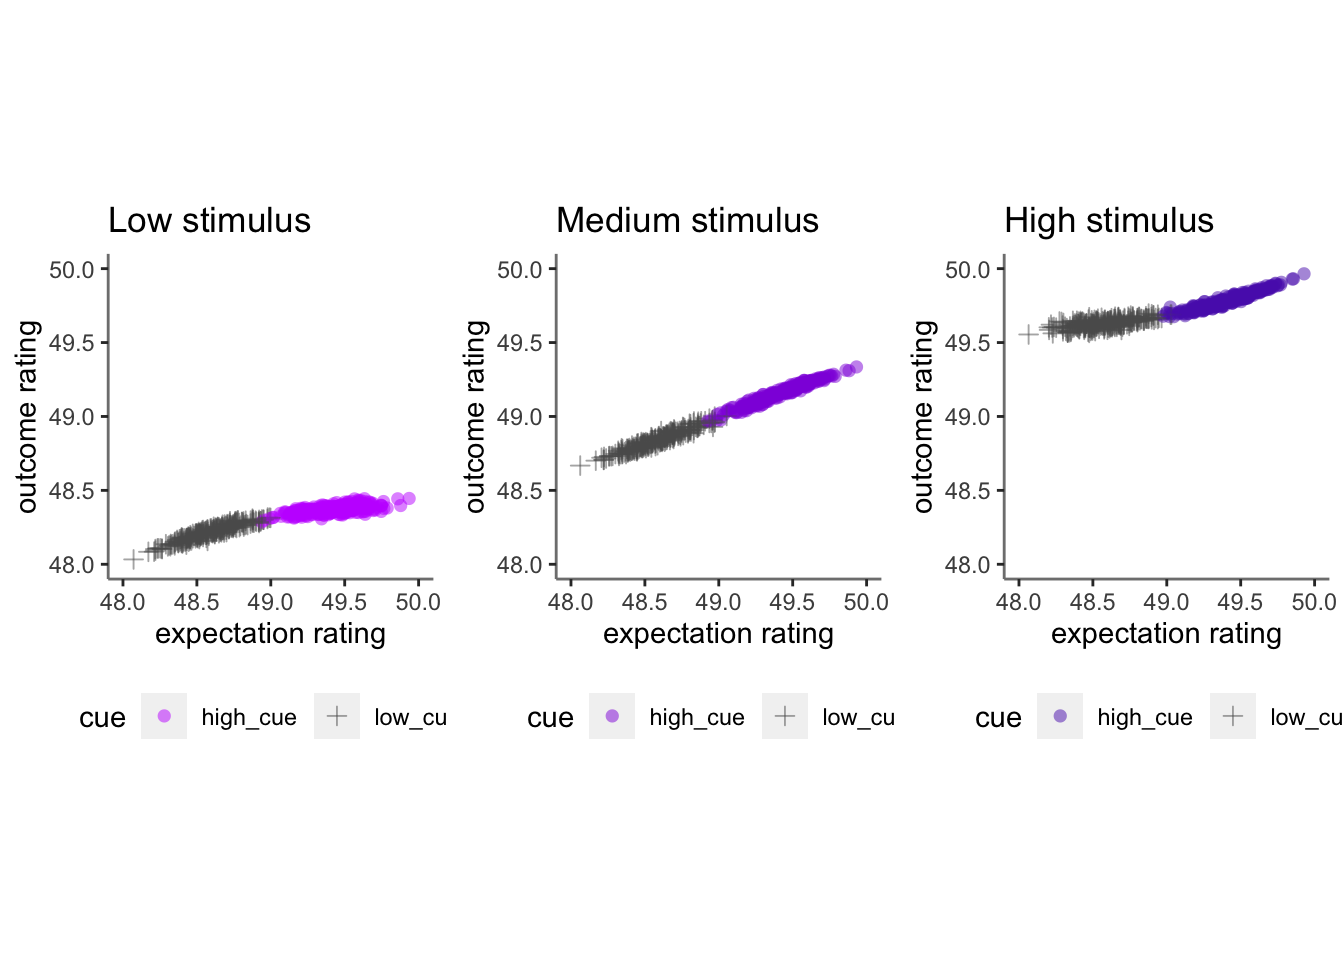
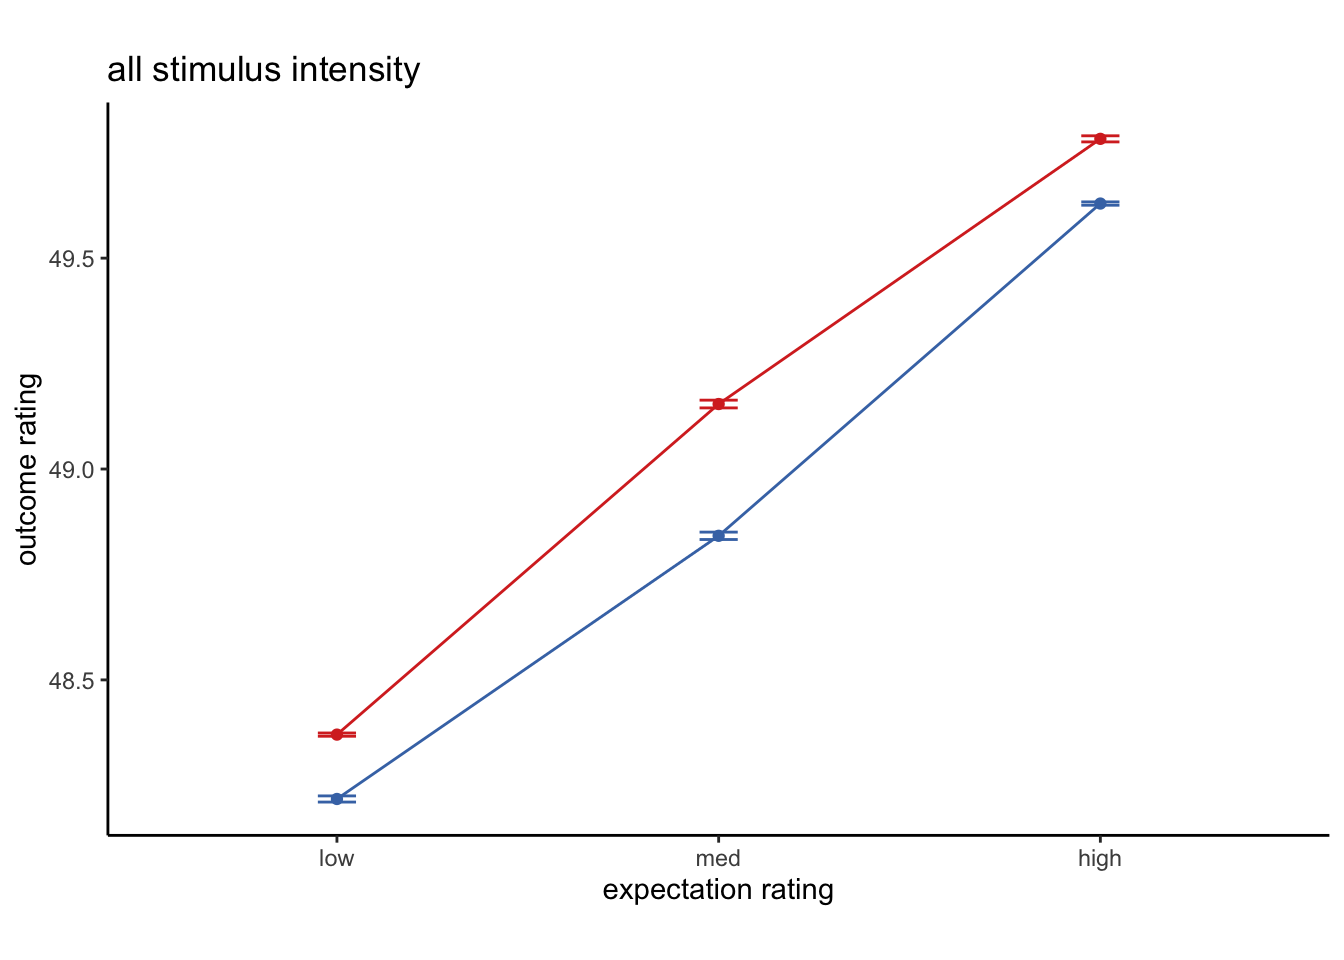
- Here, Aryan simulated behavioral outcome ratings using a reinforcement learning model.
18.1 function
# summarize dataframe __________________________________________________________
plot_twovariable <- function(df, iv1, iv2, group, subject, xmin, xmax, ymin,ymax,
xlab, ylab, ggtitle, color_scheme, alpha, fit_lm, lm_method = NULL, identity_line=TRUE, size=NULL) {
    # x: iv1 e.g. expect rating
    # y: iv2 e.g. outcome rating
    # group: param_cue_type
    # subject: src_subject_id
    # xlab("expect rating") +
    # ylab("outcome rating") +
    # color_scheme = c("high_cue" = "#000000",low_cue" = "#BBBBBB"        )
    library(ggplot2)

    df_dropna <- df[!is.na(df[, iv1]) & !is.na(df[, iv2]), ]
    subjectwise_naomit_2dv <- meanSummary_2dv(
        df_dropna,
        c(subject, group),
        iv1, iv2
    )
    # subjectwise_naomit_2dv <- na.omit(subjectwise_2dv)
    subjectwise_naomit_2dv[ , group] <- as.factor(subjectwise_naomit_2dv[, group])
    # plot _________________________________________________________________________ #nolint

    g <- ggplot(
        data = subjectwise_naomit_2dv,
        aes(
            x = .data[["DV1_mean_per_sub"]],
            y = .data[["DV2_mean_per_sub"]],
            color = .data[[group]],
            size = size
        )
    ) +
        geom_point(
            aes(shape = .data[[group]],
            color = .data[[group]]),
            size = 2,
            alpha = alpha) +

        theme(aspect.ratio = 1) +
        scale_color_manual(values = color_scheme) +
        scale_shape_manual(values = c(16, 3)) +
        xlab(xlab) +
        ylab(ylab) +
        ylim(ymin,ymax) +
        xlim(xmin,xmax) +
        ggtitle(ggtitle) +
        theme(
            axis.line = element_line(colour = "grey50"),
            panel.background = element_blank(),
            plot.subtitle = ggtext::element_textbox_simple(size = 11)
        )

    if (isTRUE(fit_lm)) {
        g <- g +
        # geom_ribbon(stat = "smooth", method = lm_method, se = FALSE, alpha = 0.1,
        #       aes(color = NULL, group = factor(group))) +
        geom_line(stat = "smooth", method = lm_method, se = FALSE, alpha = 0.8, linewidth = 1.5)
    } else {
        g
    }

    if (isTRUE(identity_line)) {
        g <- g + geom_abline(
            intercept = 0, slope = 1, color = "#373737", # color = "green"
            linetype = "dashed",
            linewidth = .5
        )
    } else {
        g
    }
    return(g)
}
plot data
group = "cue"

    iv1 = "demean_expect"
    iv2 = "demean_outcome"

    subject = "sub"
    xmin=48; xmax=50; ymin=48; ymax=50
    xlab = "expectation rating"
    ylab = "outcome rating"
    ggtitle = "all stimulus intensity"
    color_scheme = c("high_cue" ="#941100","low_cue" =  "#5D5C5C")
    alpha = .8; fit_lm = TRUE; lm_method = "lm"; identity_line=TRUE; size=NULL
    g <- ggplot(
        data = merged_df,
        aes(
            x = .data[["expectation"]],
            y = .data[["outcome"]],
            color = .data[[group]],
            size = size
        )
    ) +
        geom_point(
            aes(shape = .data[[group]],
            color = .data[[group]]),
            size = 2,
            alpha = alpha) +

        theme(aspect.ratio = 1) +
        scale_color_manual(values = color_scheme) +
        scale_shape_manual(values = c(16, 3)) +
        xlab(xlab) +
        ylab(ylab) +
        ylim(ymin,ymax) +
        xlim(xmin,xmax) +
        ggtitle(ggtitle) +
        theme(
            axis.line = element_line(colour = "grey50"),
            panel.background = element_blank(),
            plot.subtitle = ggtext::element_textbox_simple(size = 11)
        )

    if (isTRUE(fit_lm)) {
        g <- g +
        # geom_ribbon(stat = "smooth", method = lm_method, se = FALSE, alpha = 0.1,
        #       aes(color = NULL, group = factor(group))) +
        geom_line(stat = "smooth", method = lm_method, se = FALSE, alpha = 0.8, linewidth = 1.5)
    } else {
        g
    }

    if (isTRUE(identity_line)) {
        g <- g + geom_abline(
            intercept = 0, slope = 1, color = "#373737", # color = "green"
            linetype = "dashed",
            linewidth = .5
        )
    } else {
        g
    }
g
## Warning: Using `size` aesthetic for lines was deprecated in ggplot2 3.4.0.
## ℹ Please use `linewidth` instead.## `geom_smooth()` using formula = 'y ~ x'