Analysis logbook: cue-expectancy
1
About
1.1
Usage
1.2
Render book
1.3
Preview book
2
Hello bookdown
2.1
A section
An unnumbered section
3
[ beh] expectation ~ cue
3.1
Pain
3.2
Vicarious
3.3
Cognitive
3.4
Individual difference analysis
4
[ beh ] outcome ~ cue
4.1
Pain
4.2
Vicarious
4.3
Cognitive
4.4
Individual differences analysis: random cue effects
4.5
Individual differences analysis 2: random intercept + random slopes of cue effect
5
[ beh ] outcome ~ stimulus_intensity
5.1
Pain
5.2
Vicarious
5.3
Cognitive
5.4
for loop
5.5
Lineplot
5.6
individual differences in outcome rating cue effect
6
outcome_rating ~ cue * stim
6.1
What is the purpose of this notebook?
6.2
model 03 iv-cuecontrast dv-actual
6.2.1
model 03 3-2. individual difference
6.2.2
model 04 iv-cue-stim dv-actual
6.2.3
model 04 4-2 individual differences in cue effects
6.2.4
model 04 4-3 scatter plot
6.2.5
model 04 4-4 lineplot
7
expect-actual ~ cue * trial
7.1
Overview
7.2
plot 1 - one run, average across participants
7.3
plot 2 - average across participant, but spread all 6 runs in one x axis
7.4
Do current expectation ratings predict outcome ratings?
7.5
Additional analysis
8
RT ~ cue
8.0.1
parameters
8.0.2
1) plot RT data
8.0.3
plot RT distribution per participant
8.0.4
exclude participants with RT of 5 seconds
8.1
model 1:
8.2
model 1-1
8.3
model 1-2:
8.4
model 2:
9
RT ~ cue * stim
9.1
Overview model 05 iv-cue dv-RT summary
9.2
Prepare data and preprocess
9.3
model 1:
9.4
model 1-1
9.5
model 1-2:
9.6
model 2: Log transformation
9.7
Conclusion across model 1 and 2
10
cognitive RT tradeoff ~ cue * stim (withinsubject)
10.1
Overview
10.2
Why use multilevel models?
10.3
Terminology
10.4
Model versions
10.5
Method 1 one-sample t
10.6
Method 1-1 aov
10.7
Method 1-2 aov contrast-coding
10.8
Method 1 effectsize
10.9
Method 2 matlab
10.10
Method 3 multilevel modeling
Conclusion: Method 1 vs Method 3
10.11
References
10.12
Other links
11
outcome_rating ~ session (“behavioral ICC”)
11.1
Functions
11.2
TODO:
12
N-1 outcome rating ~ N expectation rating
12.0.1
DONE
12.1
Overview
12.2
Do previous outcome ratings predict current expectation ratings?
12.3
Additional analysis
12.4
Let’s demean the ratings.
12.5
DEMEAN AND THEN DISCRETIZE
13
(N-2) shifted outcome ratings ~ (N) expectation ratings; Jayazeri (2018)
13.1
Do previous outcome ratings predict current expectation ratings?
13.2
Do these models differ as a function of cue?
13.3
Demean and discretize
14
outcome ~ expect Jayazeri (2018)
14.1
Overview
14.2
Do expectation ratings predict current outcome ratings? Does this differ as a function of cue?
14.3
task-pain, HLM modeling
14.4
Fig. Expectation ratings predict outcome ratings
14.5
binned expectation ratings per task
14.5.1
Pain: binned expectation ratings
14.5.2
Vicarious: binned expectation ratings
14.5.3
Cognitive: binned expectation ratings
14.6
not splitting into cue groups
15
[ beh ] outcome ~ cue * stim * expectrating * n-1outcomerating
15.1
Original motivation:
15.2
Pain
15.2.1
pain plot parameters
15.2.2
loess
15.3
Vicarious
15.4
Cognitive
15.4.1
cognitive parameters
16
[ beh ] outcome_demean ~ cue * stim * expectrating * n-1outcomerating
16.1
linear model
16.2
Q. Are those overestimating for high cues also underestimators for low cues?
16.3
pain run, collapsed across stimulus intensity
16.4
vicarious
16.5
cognitive
16.6
across tasks (PVC), is the slope for (highvslow cue) the same?Tor question
17
[ beh ] outcome_demean_per_run ~ cue * stim * expectrating * n-1outcomerating
17.1
Linear model with three factors: cue X stim X expectation rating
17.2
Pain run, collapsed across stimulus intensity
17.3
vicarious
17.4
cognitive
17.5
across tasks (PVC), is the slope for (highvslow cue) the same?Tor question
18
NPS_contrast ~ cue * stim
18.1
Overview
18.2
regressors and contrasts
18.3
main effect: stim-linear high > low
18.4
main_effect: stim-quadratic med > high&low
18.5
interaction: cue X stim-linear
18.6
interaction: cue X stim-quadratic
19
nps_contrast ~ cue * stim
19.1
Overview
19.2
For loop for all the pvc dummy codes
20
nps_dummy ~ stim
20.1
TODO
20.2
regressors and contrasts
20.3
Functions
20.4
Pain
20.5
Vicarious
20.6
Cognitive
21
NPSdummy ~ stim * task (contrast-scaled)
21.1
Raincloud plots
21.2
Line plots
22
fMRI Pain signature ~ single trial
22.1
PVC all task comparison
22.2
Pain only Stim x cue interaction
22.2.1
2x3 stimulus intensity * cue
22.2.2
Linear model
22.2.3
NPS stimulus intensity Cohen’s d = 1.287
22.2.4
NPS stimulus & cue effect size: stim_d = 1.16, cue_d = 0.45
22.2.5
Lineplots
22.3
Pain only: Outcome ratings & NPS
22.3.1
outcome ratings * cue
22.4
Pain only: Expectation ratings & NPS
23
fMRI Pain signature ~ single trial
23.1
PVC all task comparison
23.2
Vicarious only Stim x cue interaction
23.2.1
2x3 stimulus intensity * cue
23.2.2
Linear model
23.2.3
VPS stimulus intensity Cohen’s d = 0.2131521
23.2.4
VPS stimulus & cue effect size: stim_d = 0.217, cue_d = 0.013
23.2.5
Lineplots
23.2.6
Linear model with Stim x Cue x Expectation rating
23.3
Vicarious only: Outcome ratings & VPS
23.3.1
outcome ratings * cue
23.4
Vicarious only: Expectation ratings & VPS
24
Cognitive signature ~ single trial
24.1
PVC all task comparison
24.2
Cognitive only Stim x cue interaction
24.2.1
2x3 stimulus intensity * cue
24.2.2
Linear model
24.2.3
Cog stimulus intensity Cohen’s d = 0.72
24.2.4
Cognitivee stimulus & cue effect size: stim_d = 0.73, cue_d = 0.069
24.2.5
Lineplots
24.3
Cognitive only: Outcome ratings & Kragel 2018
24.3.1
outcome ratings * cue
24.4
Cognitive only: Expectation ratings & NPS
25
single trial correlation between cue and stim ~ cue x stim
25.1
Stack data
25.2
plot correlation (one-sample-t)
25.3
Lineplot
26
signature effect size ~ single trial
26.1
effeect size
26.2
contrastt (stim intensity)
26.3
layer in metadata
27
VIF
27.1
load in the datamatrix and calculate the vif
28
vif
29
biomarker NPS ~ cue x stim (2022)
29.1
load libraries
29.1.1
NPS cue effect
29.2
NPS stim effect
29.3
VPS
29.4
VPS cue effect
29.5
VPS stim effect
Published with bookdown
behavioral_ICC
Chapter 29
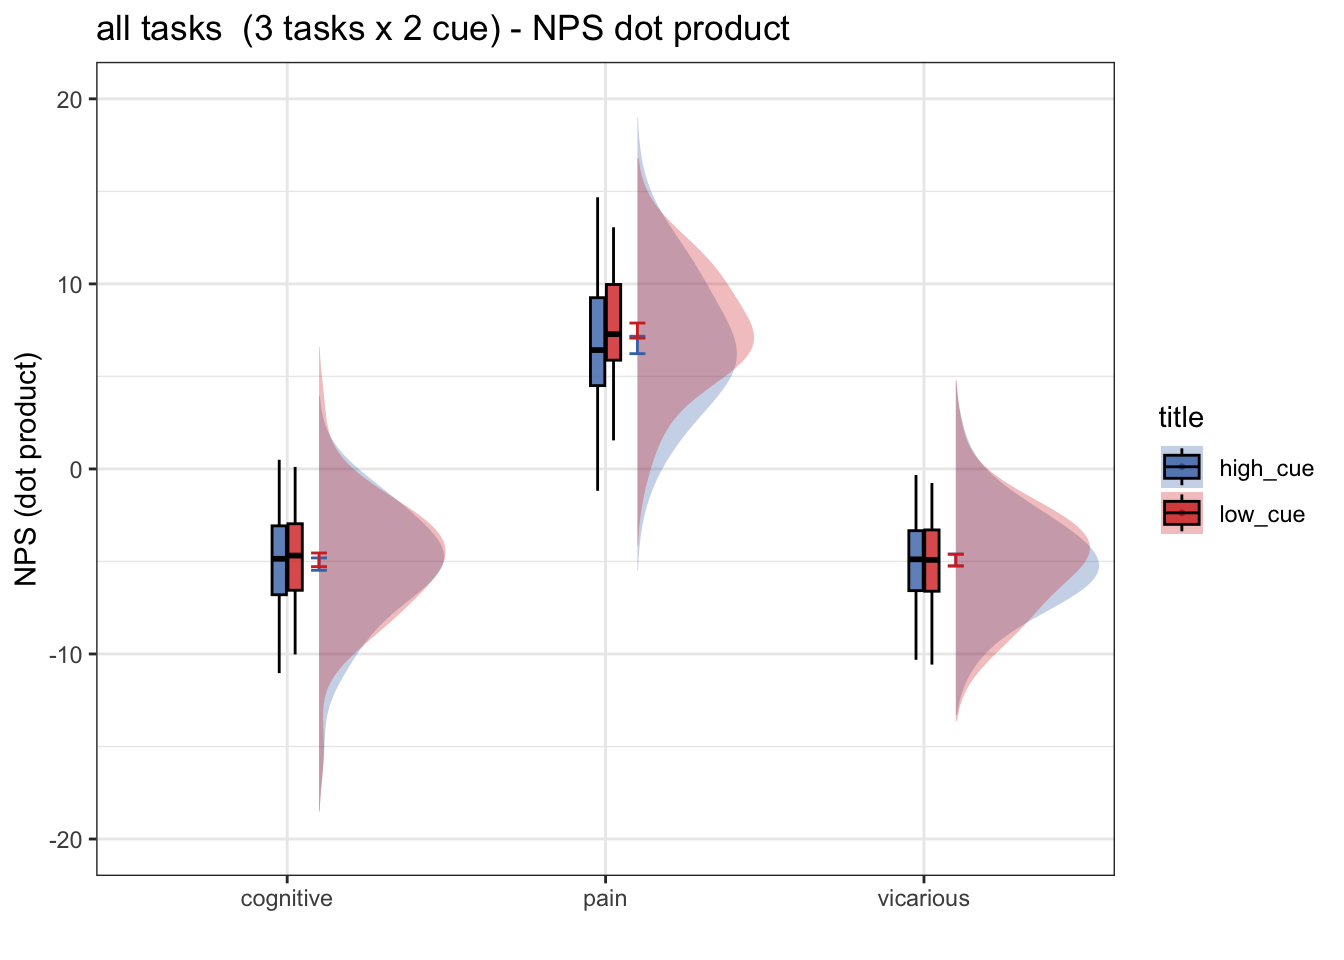
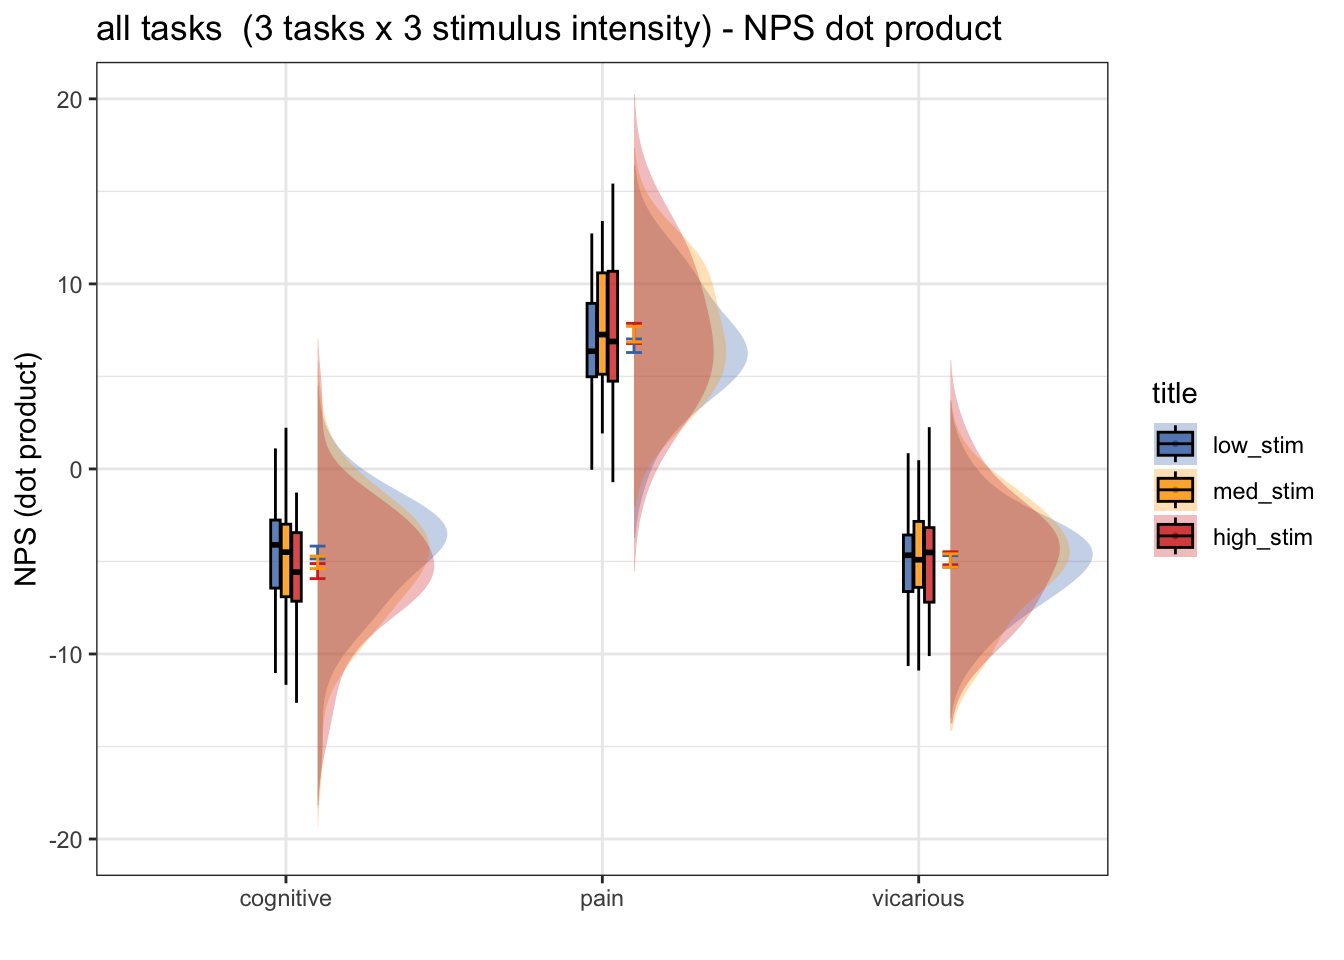
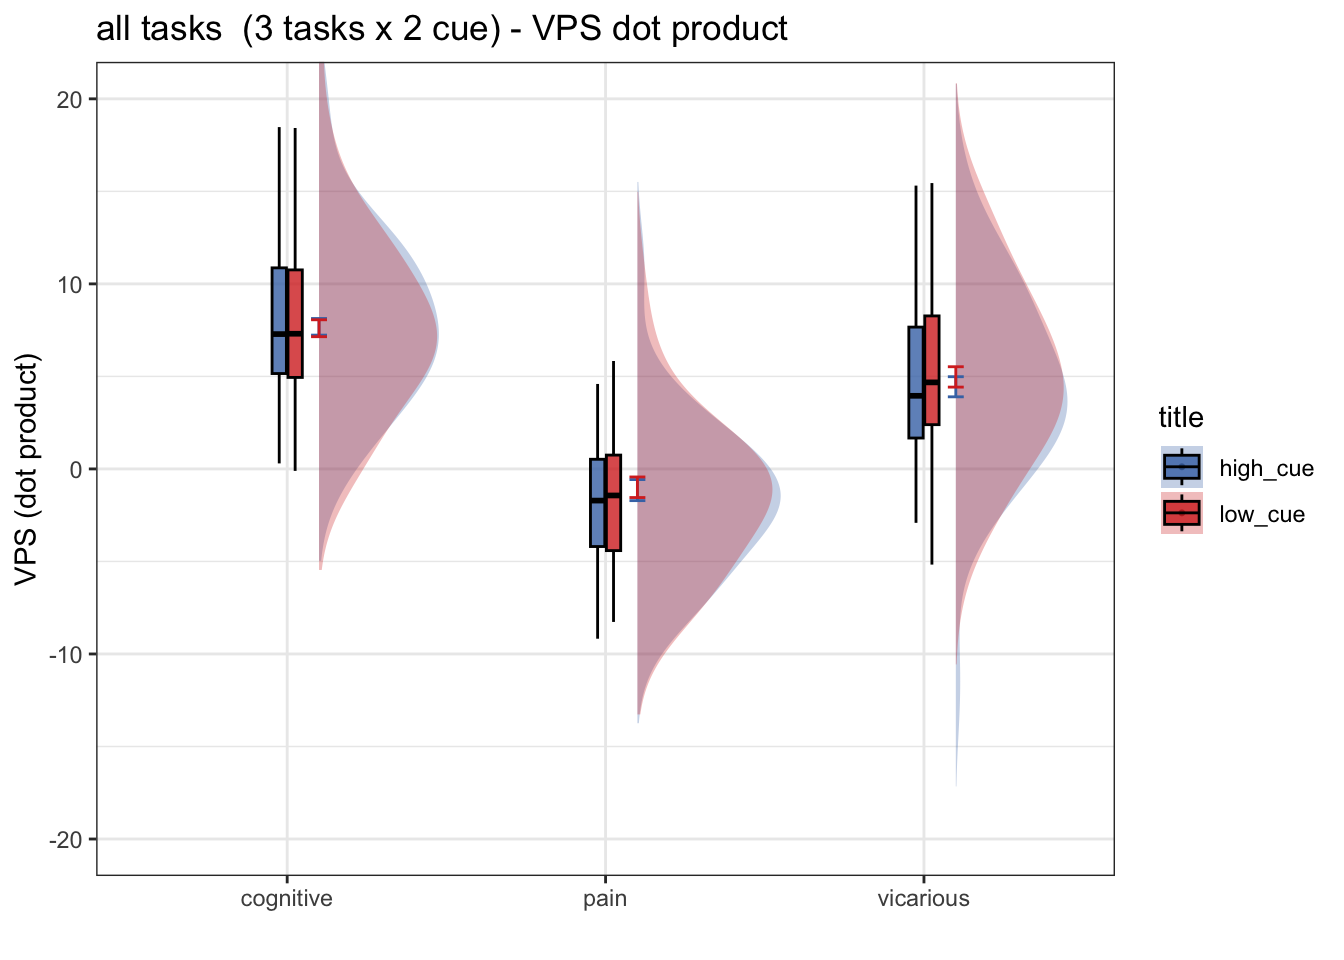
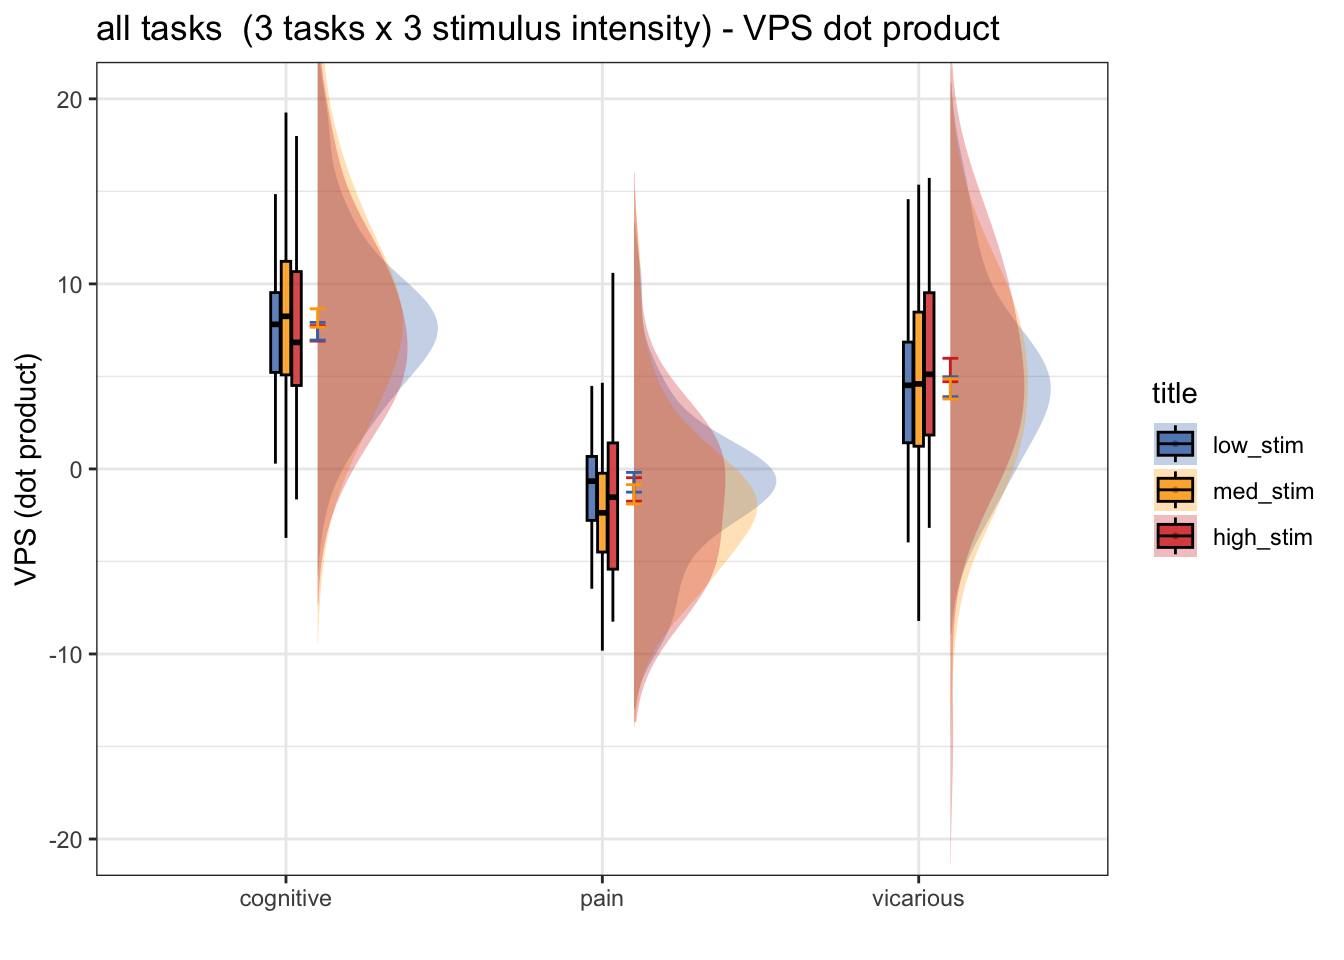
biomarker NPS ~ cue x stim (2022)
author: "Heejung Jung"
date: "6/12/2022"
output: html_document
29.1
load libraries
NPS load csv file
NPS run 2 factor model (task x cue)
29.1.1
NPS cue effect
29.2
NPS stim effect
29.3
VPS
VPS load csv file
VPS run 2 factor model (task x cue)
29.4
VPS cue effect
29.5
VPS stim effect