12 RL :: simulation
title: “Your Document Title” output: html_notebook
What is the purpose of this notebook?
- Here, Aryan simulated behavioral outcome ratings using a reinforcement learning model.
12.1 function
# summarize dataframe __________________________________________________________
plot_twovariable <- function(df, iv1, iv2, group, subject, xmin, xmax, ymin,ymax,
xlab, ylab, ggtitle, color_scheme, alpha, fit_lm, lm_method = NULL, identity_line=TRUE, size=NULL) {
    # x: iv1 e.g. expect rating
    # y: iv2 e.g. outcome rating
    # group: param_cue_type
    # subject: src_subject_id
    # xlab("expect rating") +
    # ylab("outcome rating") +
    # color_scheme = c("high_cue" = "#000000",low_cue" = "#BBBBBB"        )
    library(ggplot2)

    df_dropna <- df[!is.na(df[, iv1]) & !is.na(df[, iv2]), ]
    subjectwise_naomit_2dv <- meanSummary_2continuous(
        df_dropna,
        c(subject, group),
        iv1, iv2
    )
    # subjectwise_naomit_2dv <- na.omit(subjectwise_2dv)
    subjectwise_naomit_2dv[ , group] <- as.factor(subjectwise_naomit_2dv[, group])
    # plot _________________________________________________________________________ #nolint

    g <- ggplot(
        data = subjectwise_naomit_2dv,
        aes(
            x = .data[["DV1_mean_per_sub"]],
            y = .data[["DV2_mean_per_sub"]],
            color = .data[[group]],
            size = size
        )
    ) +
        geom_point(
            aes(shape = .data[[group]],
            color = .data[[group]]),
            size = 2,
            alpha = alpha) +

        theme(aspect.ratio = 1) +
        scale_color_manual(values = color_scheme) +
        scale_shape_manual(values = c(16, 3)) +
        xlab(xlab) +
        ylab(ylab) +
        ylim(ymin,ymax) +
        xlim(xmin,xmax) +
        ggtitle(ggtitle) +
        theme(
            axis.line = element_line(colour = "grey50"),
            panel.background = element_blank(),
            plot.subtitle = ggtext::element_textbox_simple(size = 11)
        )

    if (isTRUE(fit_lm)) {
        g <- g +
        # geom_ribbon(stat = "smooth", method = lm_method, se = FALSE, alpha = 0.1,
        #       aes(color = NULL, group = factor(group))) +
        geom_line(stat = "smooth", method = lm_method, se = FALSE, alpha = 0.8, linewidth = 1.5)
    } else {
        g
    }

    if (isTRUE(identity_line)) {
        g <- g + geom_abline(
            intercept = 0, slope = 1, color = "#373737", # color = "green"
            linetype = "dashed",
            linewidth = .5
        )
    } else {
        g
    }
    return(g)
}
plot expectation and outcome ratings per cue X stim
group <- "cue"

iv1 <- "demean_expect"
iv2 <- "demean_outcome"

subject <- "sub"
xmin <- 48;xmax <- 50
ymin <- 48;ymax <- 50
xlab <- "expectation rating"
ylab <- "outcome rating"
ggtitle <- "all stimulus intensity"
color_scheme <- c("high_cue" = "#941100", "low_cue" =  "#5D5C5C")
alpha <- .8
fit_lm <- TRUE
lm_method <- "lm"
identity_line <- TRUE
size <- NULL
g <- ggplot(data = merged_df,
            aes(
              x = .data[["expectation"]],
              y = .data[["outcome"]],
              color = .data[[group]],
              size = size
            )) +
  geom_point(aes(shape = .data[[group]],
                 color = .data[[group]]),
             size = 2,
             alpha = alpha) +
  theme(aspect.ratio = 1) +
  scale_color_manual(values = color_scheme) +
  scale_shape_manual(values = c(16, 3)) +
  xlab(xlab) +
  ylab(ylab) +
  ylim(ymin, ymax) +
  xlim(xmin, xmax) +
  ggtitle(ggtitle) +
  theme(
    axis.line = element_line(colour = "grey50"),
    panel.background = element_blank(),
    plot.subtitle = ggtext::element_textbox_simple(size = 11)
  )


if (isTRUE(fit_lm)) {
  g <- g +
    geom_line(
      stat = "smooth",
      method = lm_method,
      se = FALSE,
      alpha = 0.8,
      linewidth = 1.5
    )
} else {
  g
}

if (isTRUE(identity_line)) {
  g <- g + geom_abline(
    intercept = 0,
    slope = 1,
    color = "#373737",
    # color = "green"
    linetype = "dashed",
    linewidth = .5
  )
} else {
  g
}
g
## Warning: Using `size` aesthetic for lines was deprecated in ggplot2 3.4.0.
## ℹ Please use `linewidth` instead.
## This warning is displayed once every 8 hours.
## Call `lifecycle::last_lifecycle_warnings()` to see where this warning was
## generated.## `geom_smooth()` using formula = 'y ~ x'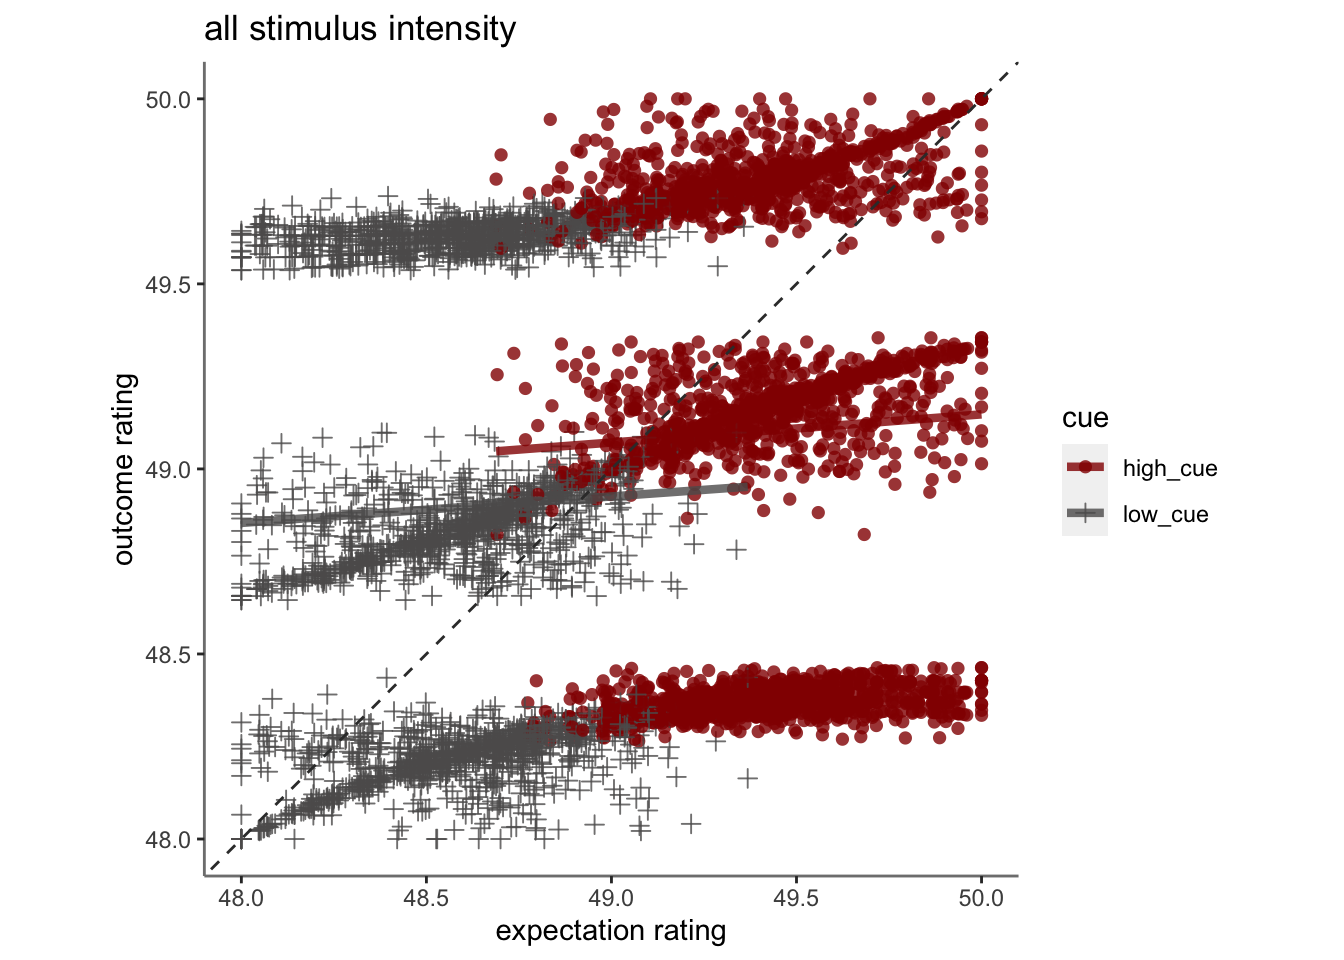
The curvature resembles the demeaned ratings that we observed.
12.2 plot expectation and outcome, collapsing across all stimulus intesnity
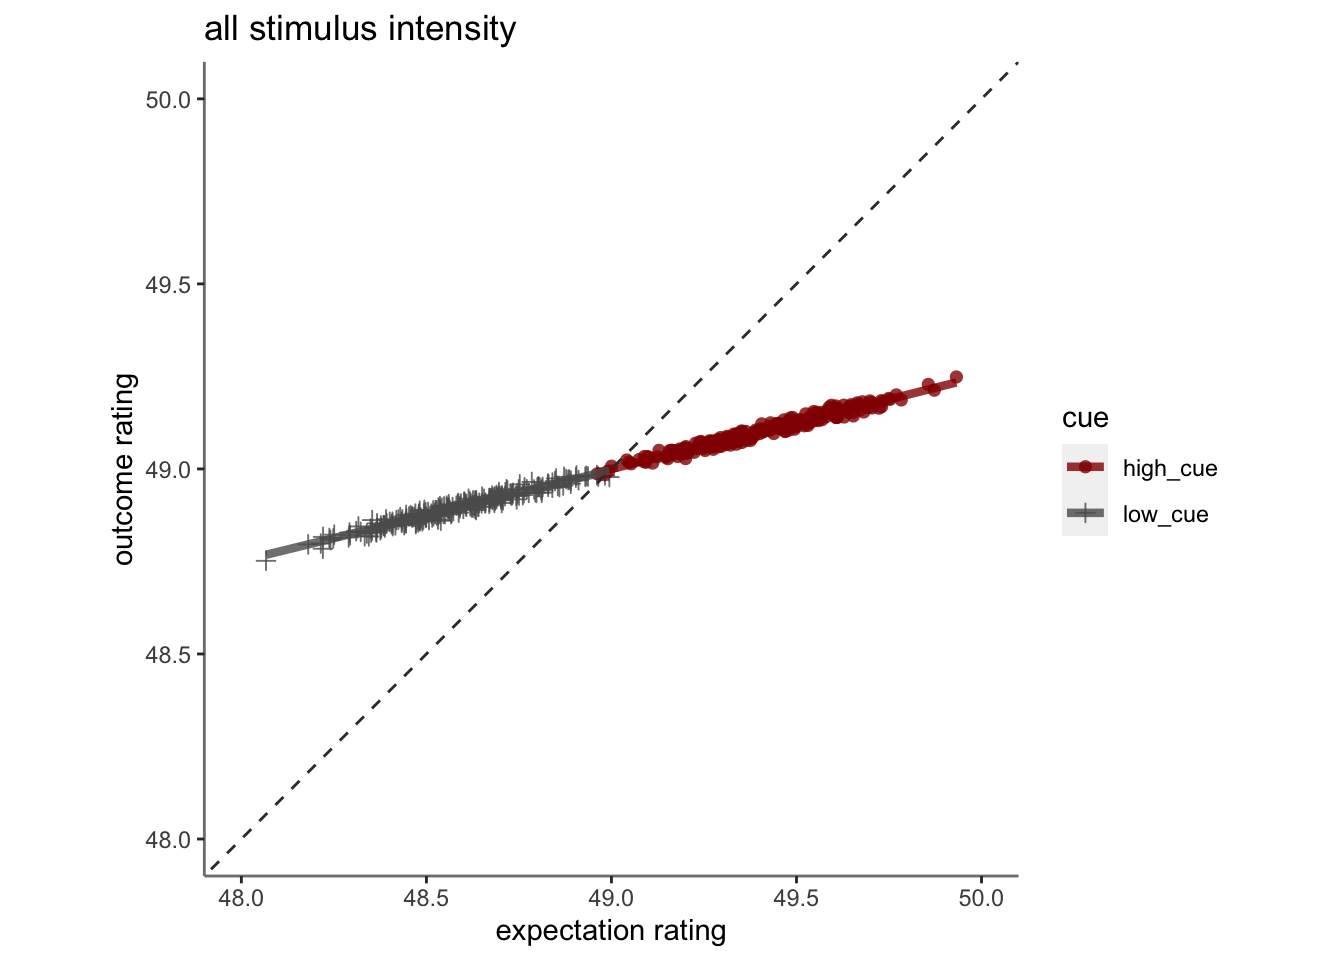
Given both ratings are demeaned, the intercept is the mean of the intensity ratings (49 C).
12.3 Plot Outcome as a function of stim X cue X Expectation rating
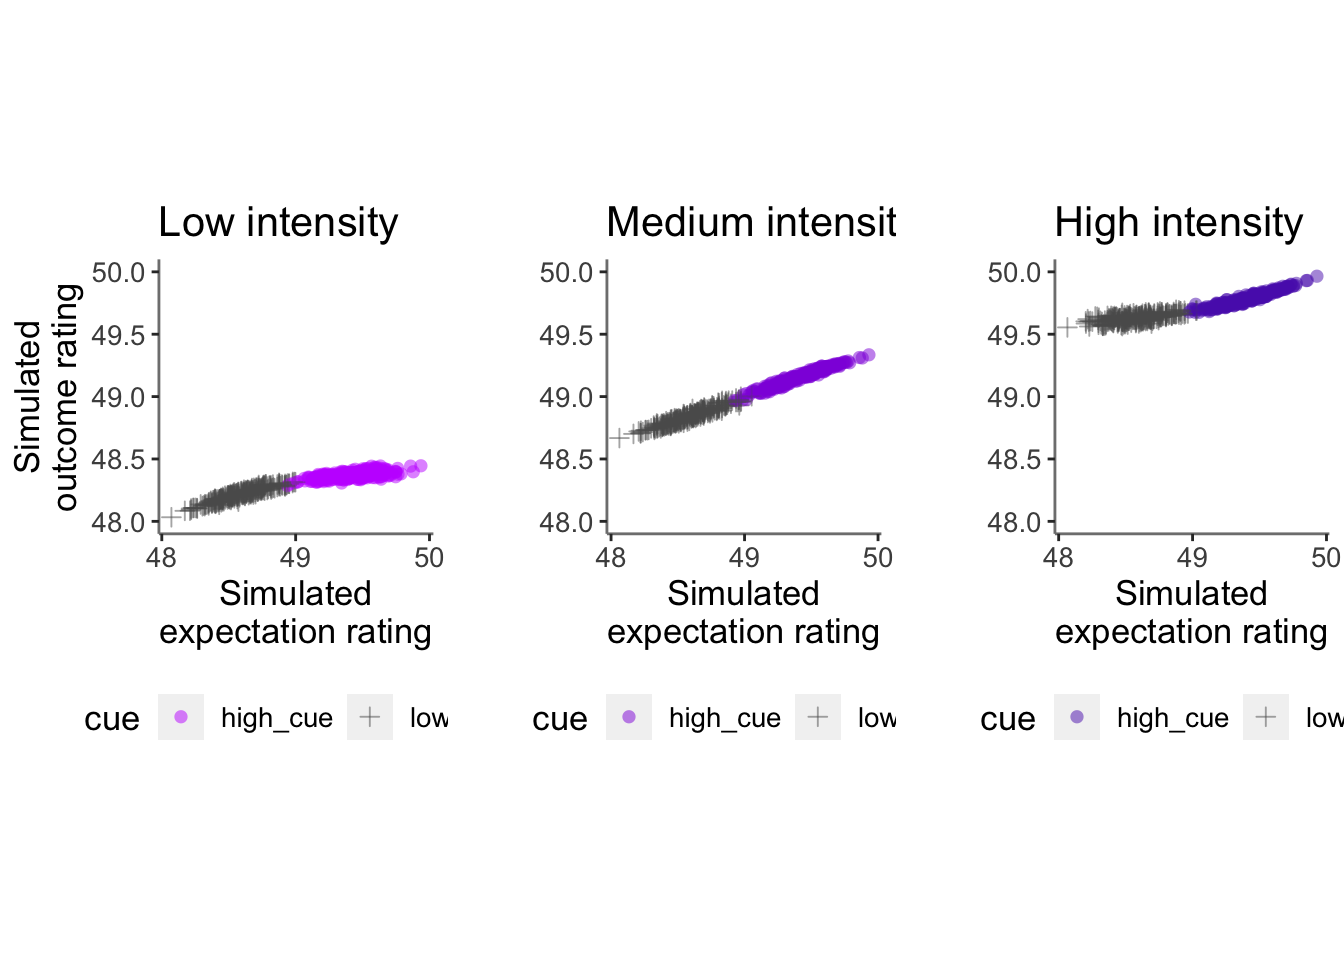
12.3.1 plot cue and
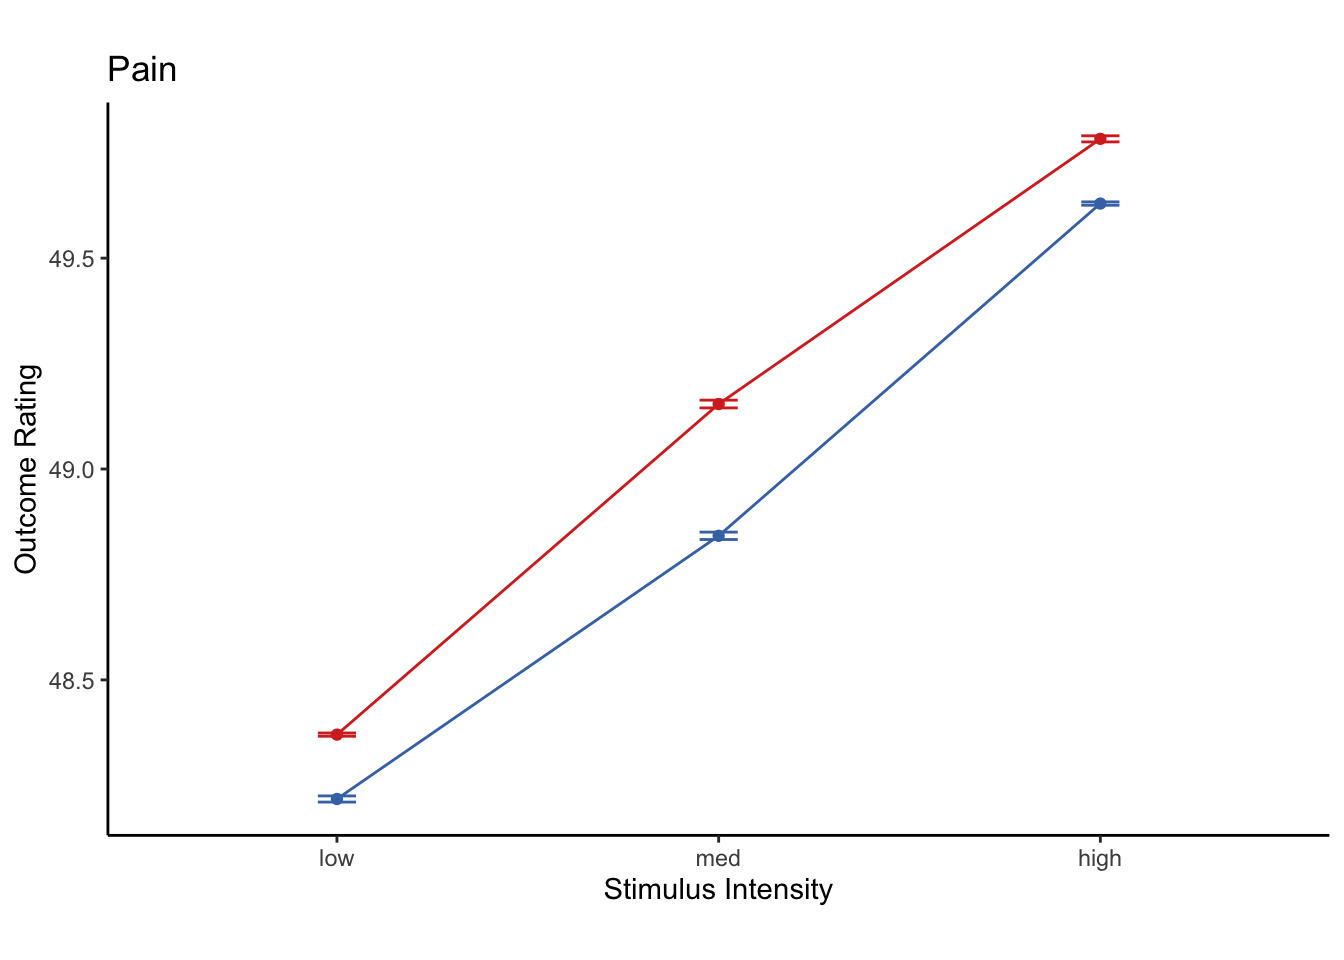
The cue and stim effects are signficiant, but the mid range is different. The behaviorla data shows that the medium intensity has smaller cue effects compared to the high and low cues, whereas the current simulations show the opposite trend. Not sure if we should read too much into this.